This engineering note discusses the commercial checkride 8s on pylons maneuver. The governing physics are used to derive the pivotal altitude and two strategies for adjusting the maneuver for lower powered aircraft.
Category Archives: Aviation
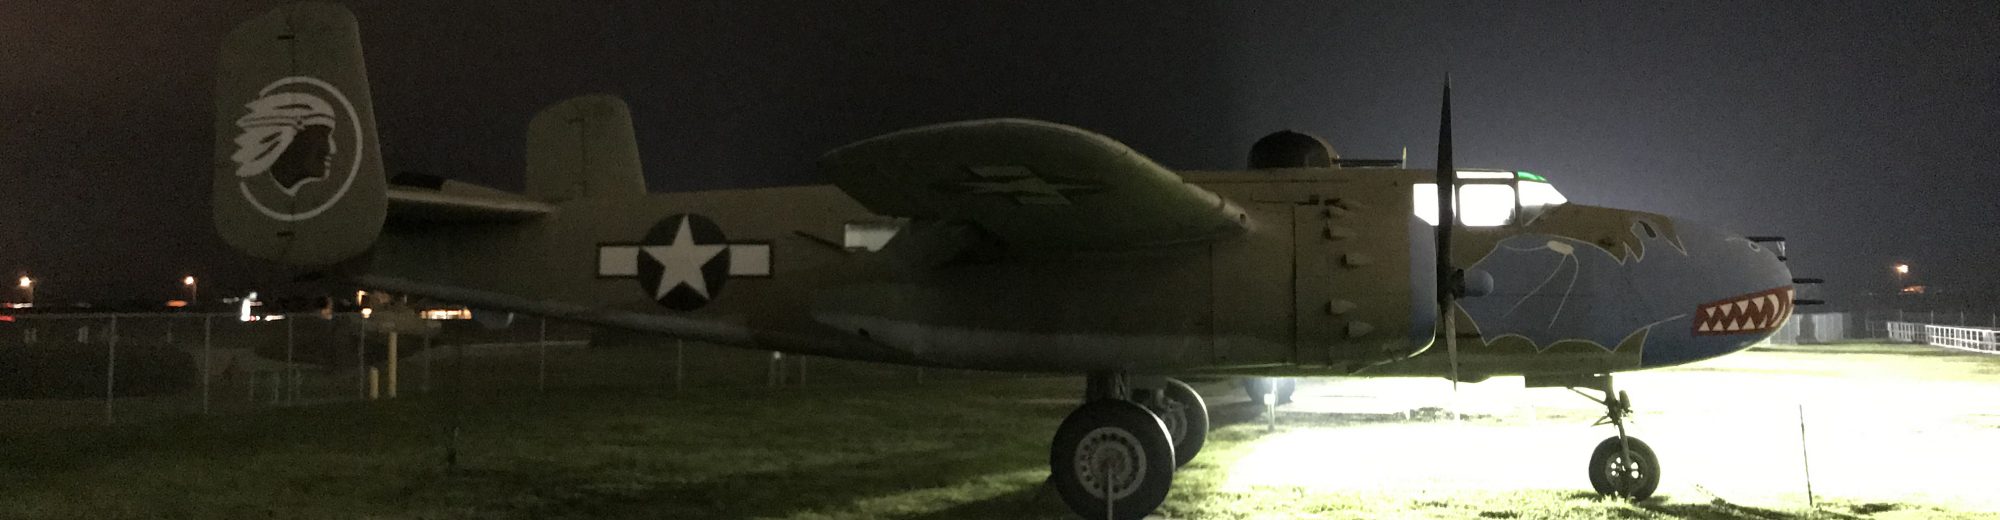
Maneuvering Speed. Corner Velocity
In this engineering talk to the Texas Flying Club, I discussed maneuvering speed (aka corner velocity). This talk includes a discussion of the physics, applied calculations for the club’s Cessna 172 with a 2400 pound STC, references and discussions of the CAR 3 regulations governing most older aircraft, and a discussion of limitations of the regulations.
The important points to remember are:
- Maneuvering Speed only effectively protects against a SINGLE control input.
- Reduce Va at lower weights. A good rule of thumb is a reduction by half the weight ratio.
- Negative load limits and maneuvering speed are less than the positive load limits and Va.
Pilot Rules of Thumb for Angles and Rates
This discussion of angles and rates for pilots will be presented at the Jan 2025 meeting of the Texas Flying Club.
Pathfinder Performance
These are the slides for the Texas Flying Club’s Pathfinder clinic.
Takeoff Performance Talk
I presented a takeoff performance talk at the Texas Flying Club. This discusses the theoretical and practical applications of takeoff performance.
Turning Inbound: A mathematical solution
When should you start your turn inbound to exactly ensure the needle will be centered? This post explains and demonstrates a quick mental math solution. First, the answer:
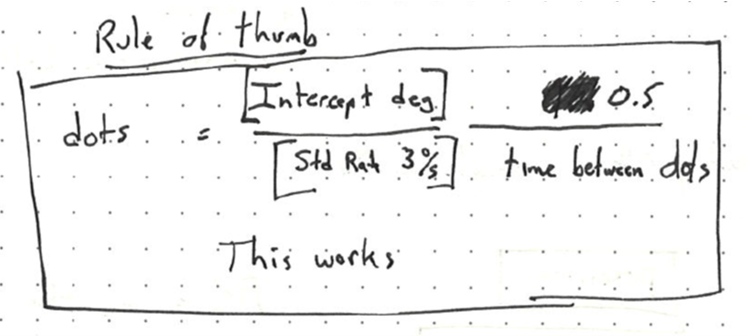
Begin your turn no later than the CDI dot corresponding to one-half of the angle to intercept divided by 3 and divided by the time to pass from one CDI dot to the next.
This solution works for turning inbound & outbound for tracking a VOR radial, a LOC/ILS, or any situation where you can count intervals leading up to a desired track.
Example
You are on a 45 degree intercept. The needle is alive and you count 4 seconds between CDI dots.

The mental math is: 45 divided by 3 is 15….. 15 divided by 4 is about 4…. Half of 4 is 2. Turn no later than 2 dots.

Derivation:

The pilot needs a quicker and more intuitive solution. We can simplify this engineering-style intercept equation with a few steps.

Thus the pilot solution in words is: Begin your turn no later than the CDI dot corresponding to one-half of the angle to intercept divided by 3 and divided by the time to pass from one CDI dot to the next.
Experimentally Developed Solution:
Full disclosure: I did not initially develop this intercept solution based on the mathematics. Rather, I experimentally flew many intercepts and developed the following rule of thumb. By a complete stroke of luck, the experimental solution happens to be exactly identical to the mathematical solution above.
Disclaimer
This solution is only meant for intuition and the mathematical understanding of intercepts. You must follow ATC, the appropriate regulations and standard operating procedures when flying. Find and train with an instructor, preferably with a CFII. No exceptions!
DME Arc Geometry
In this note, you will discover a trigonometric identity to assist maintaining a DME arc. The DME arc is a common maneuver for instrument approach procedures consisting of flying a specified distance from a DME site. The VOR/DME-A approach (Figure 1) uses an 18 nm arc from the CLL Vortac at (1) to provide two arcs (highlighted in yellow) from IAFs at OWANY at (2) and OWDIM at (4) towards JISPU at (3).
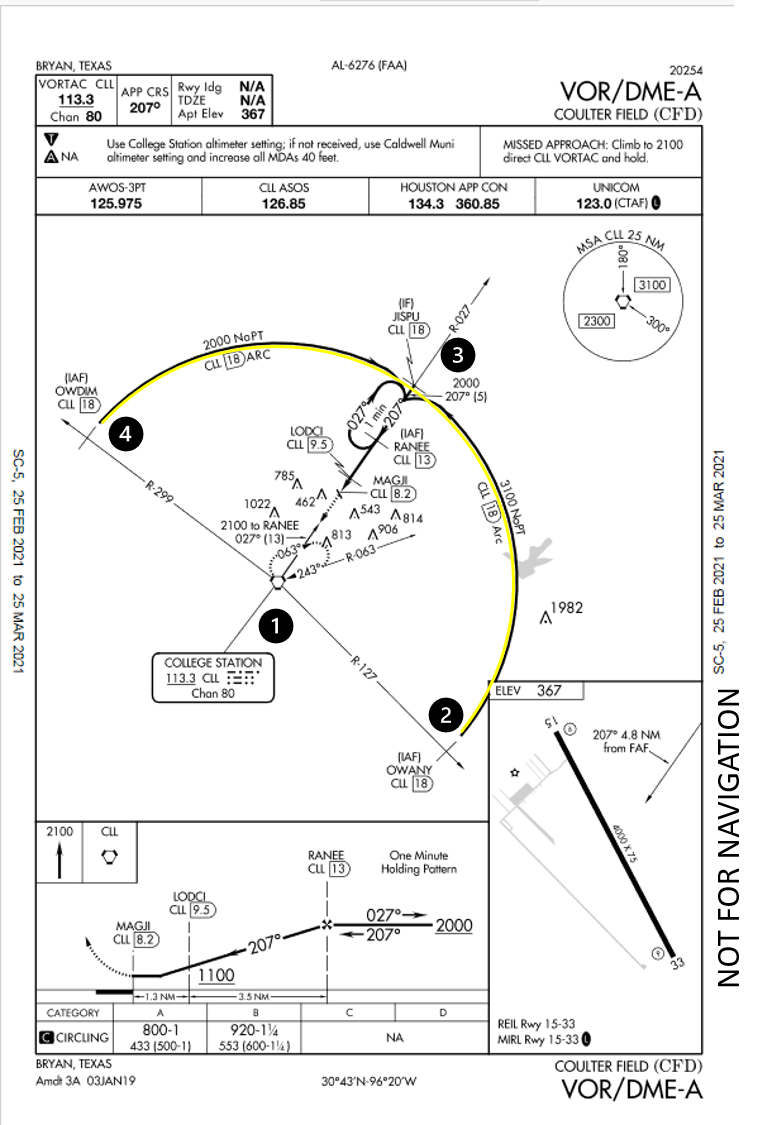
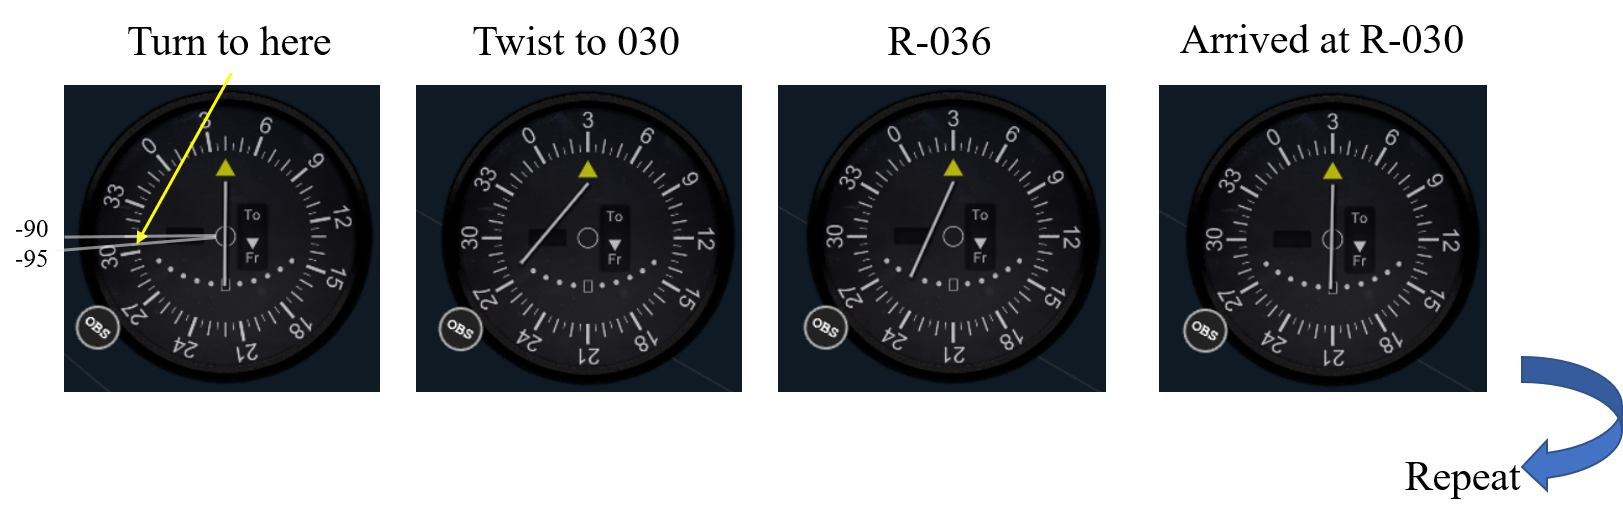
Using a Turn-Twist strategy, once on the arc, the heading to fly is tangent to the arc. This makes the no-wind control law: Turn to heading = Radial plus 90 deg when CW or Radial minus 90 deg when CCW. Unfortunately, this control strategy contains inherent divergence; in other words, the aircraft always tracks outside the desired arc (Figure 2, left). With a Turn 10/Twist 10 step, the cross track error is 1.5%. For example, a 20 nm arc with 10 degree radial steps, would give 0.3 nm error every step.
Is there a correction to exactly remain on the arc given a Turn-Twist step? Yes, and amazingly enough, the result is exact and a trigonometric identity. The right portion of Figure 2 derives a correction angle (gamma) such that the exact track is from point A to point B, both on the same arc. The result is that exactly half the Turn/Twist angle is applied inside the normal +-90 heading.

For example, using a Turn 10/Twist 10 in a counter clockwise direction at the R-040 would require the heading be 305 degrees; this heading will precisely keep you on the exact DME arc at the R-030 radial.
Warning: The normal flying caveats apply: 1) This is only meant for insight and is not meant as instruction or as a change to your specific flight operations manual, 2) wind will require varying correction angles, and 3) aviate, navigate, communicate.
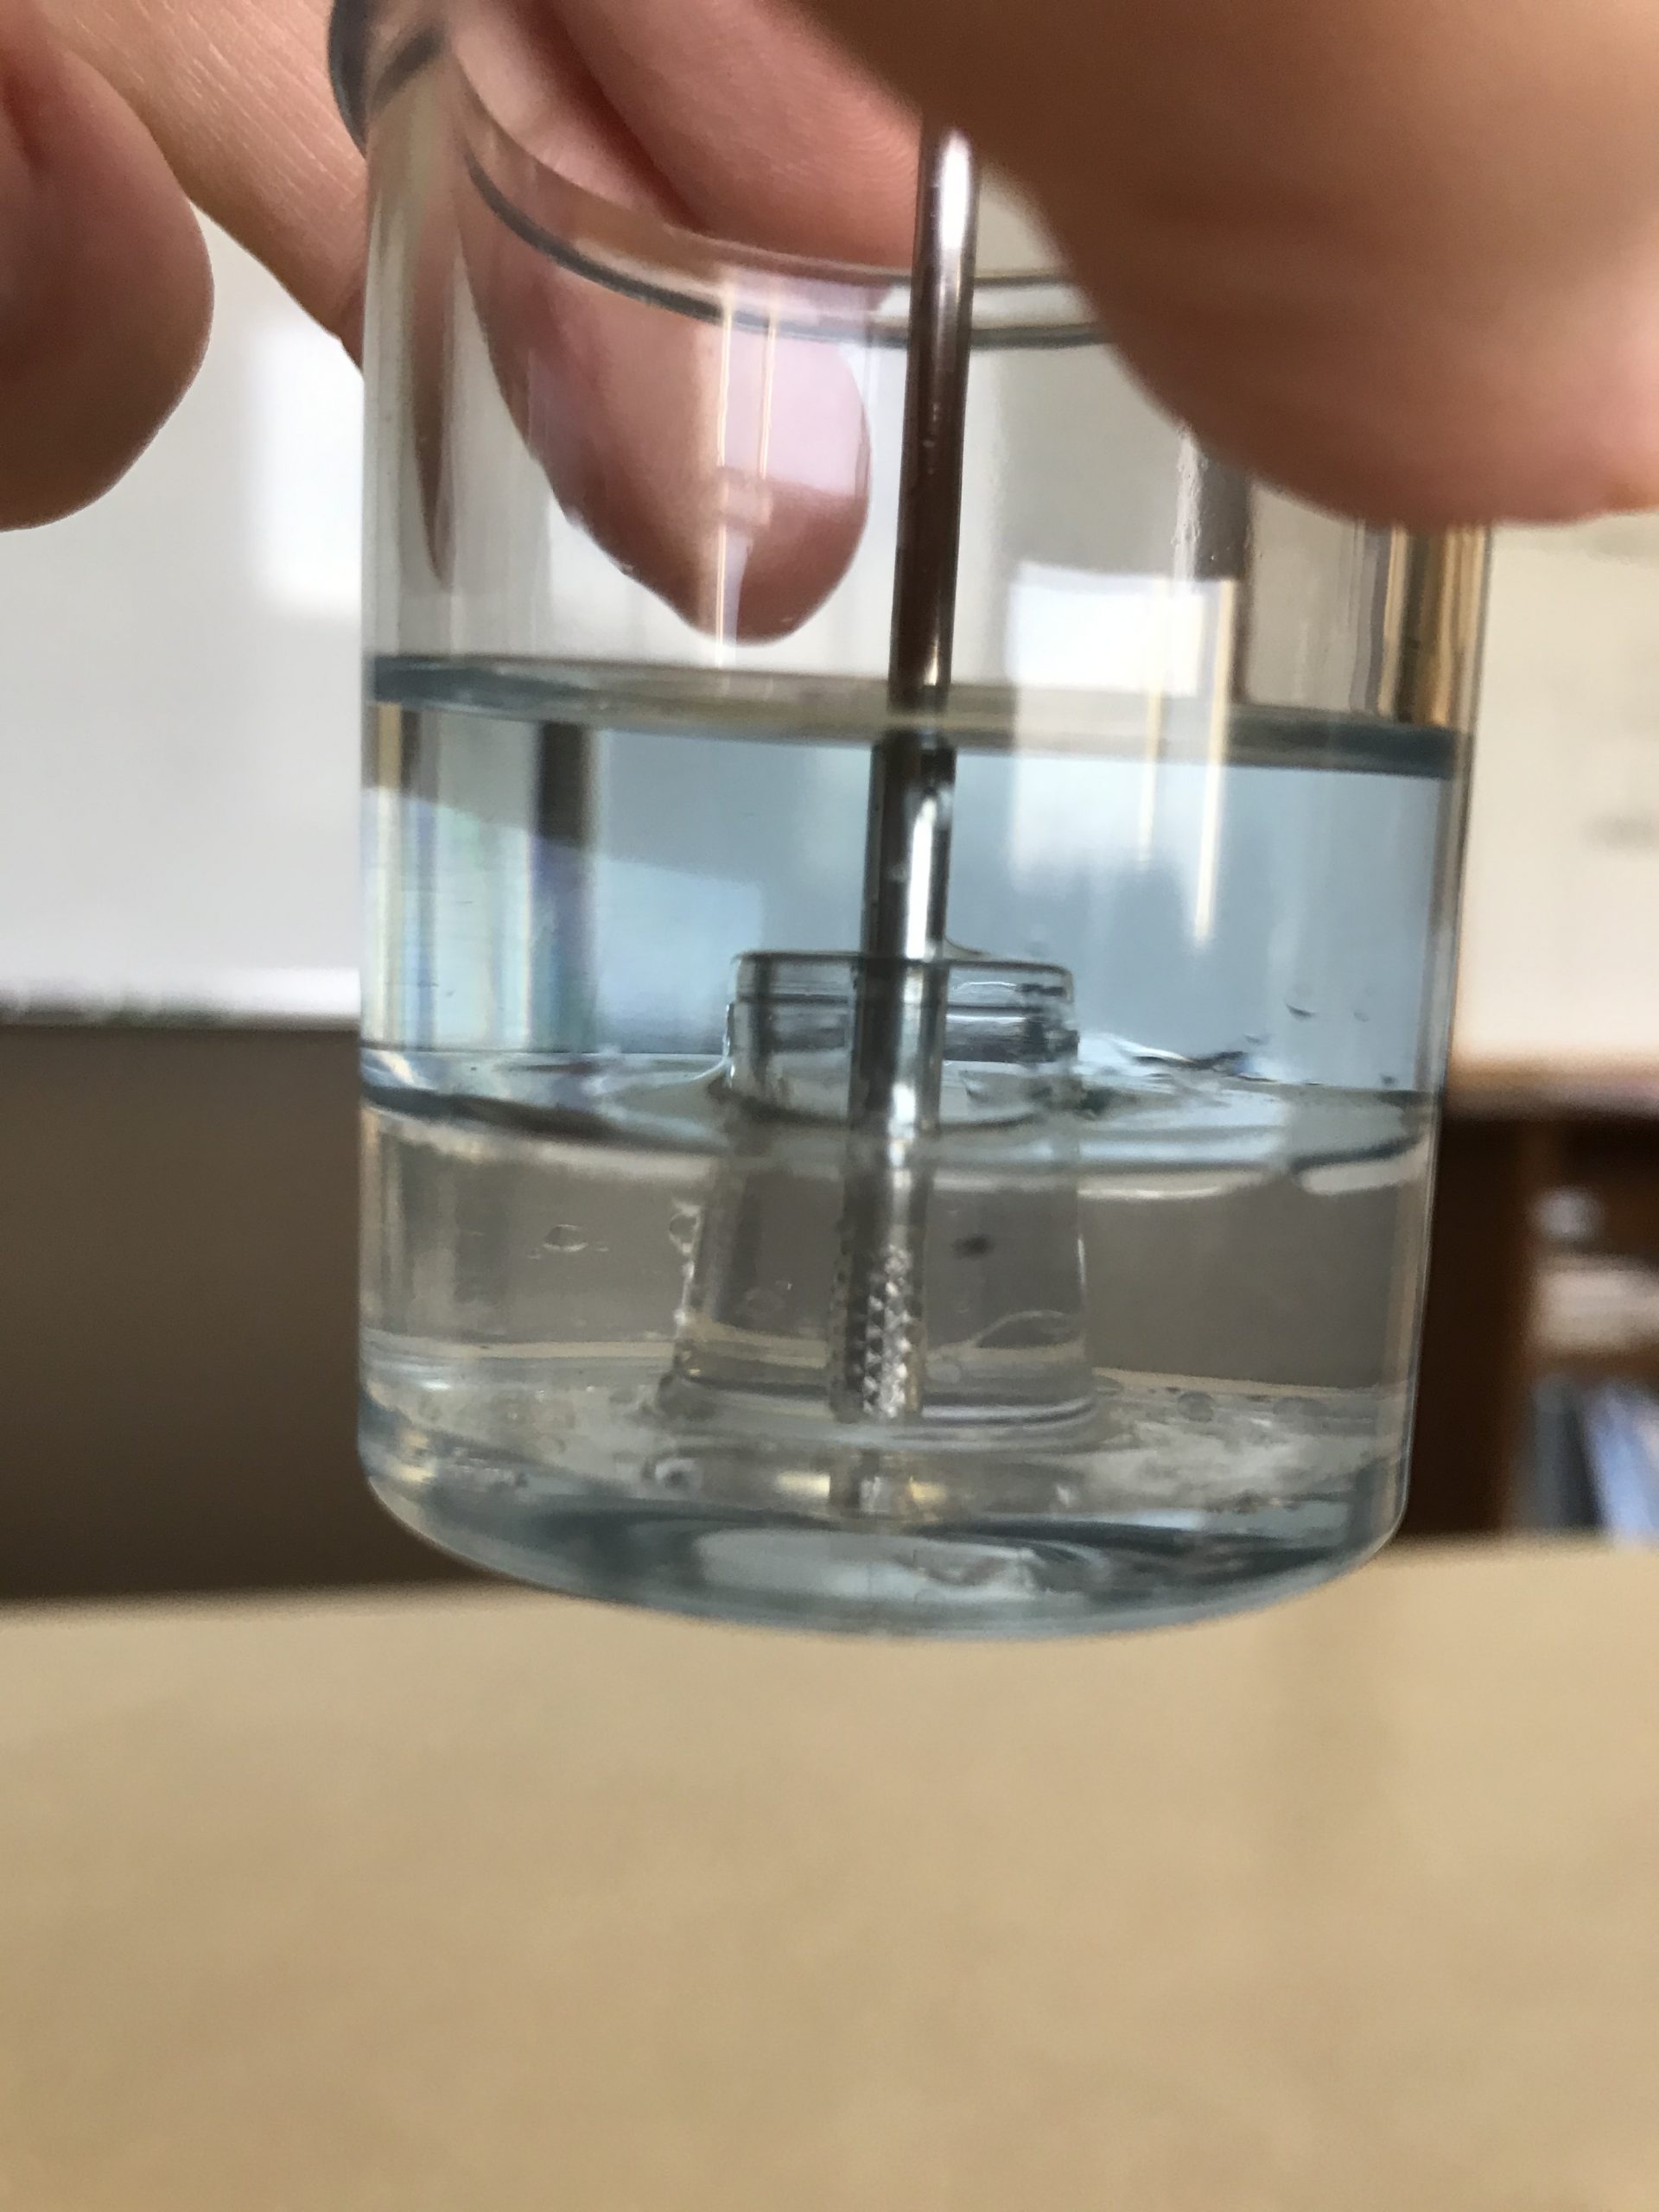
Water Condensation & Fuel Tanks
How much liquid water is generated in a fuel tank due to condensation? This is an engineering analysis focused on aviation, where water in the fuel tanks is a known cause of accidents. There is plenty of anecdotal evidence and opinions ranging from “Never happens” to “Critical in humid areas”. At the end of this note, you will be able to understand the physics and quantify the generation rate. Let’s get started.
Summary
- Nearly empty light-aircraft tanks in extreme hot and humid environments with extreme temperature swings theoretically could condense approximately a couple of fluid ounces a week.
- The generation rate linearly scales with empty tank volume and humidity, but exponentially with temperature.
- Normally vented tanks substantially reduce the water influx rate, but do have a breathing mode that can pump moist air during temperature and pressure swings.
- Condensation is more likely to be a long term storage threat; Large volumes of water are more likely to be ingress of liquid water.
Dry & Wet Air
Water is a key enabler of life and dramatically affects the behavior of air. We call “dry air” the mixture of mostly nitrogen (80%), oxygen (20%), and trace other constituents (Ar, carbon dioxide, etc). “Wet air” is what we normally encounter and is dry air + water. “Air” could also include particles + bugs + dirt. You can learn more at my course notes here for an introduction and here for non-standard atmospheres.
The important takeaways are:
- Adding water decreases air density since water has a lower molecular mass than air. (Technical note: Water has 2 Hydrogen of mass 1 plus 1 Oxygen of mass 16 for a total of 18. Air on the other hand has 80% diatomic Nitrogen of mass 28 and 20% diatomic Oxygen at mass 32 for a total of 28.97.).
- Increasing temperature substantially increases the absolute water carrying capacity of air. Water vapor at 100% relative humidity consists of 0.7% of the wet air mass at 50 F and 6% at 110 F, but a whopping 15% at 140 F. This is why pilots need to be much more concerned with high humidity at high temperatures and not so much at lower temperatures (This is in addition to the temperature effects on density altitude).
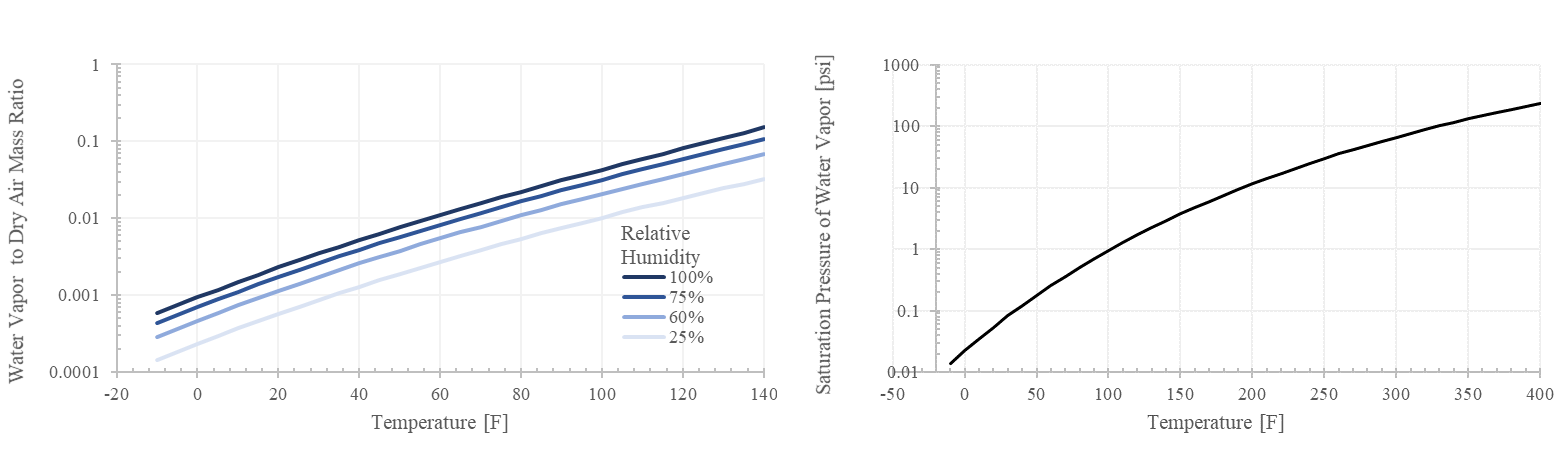
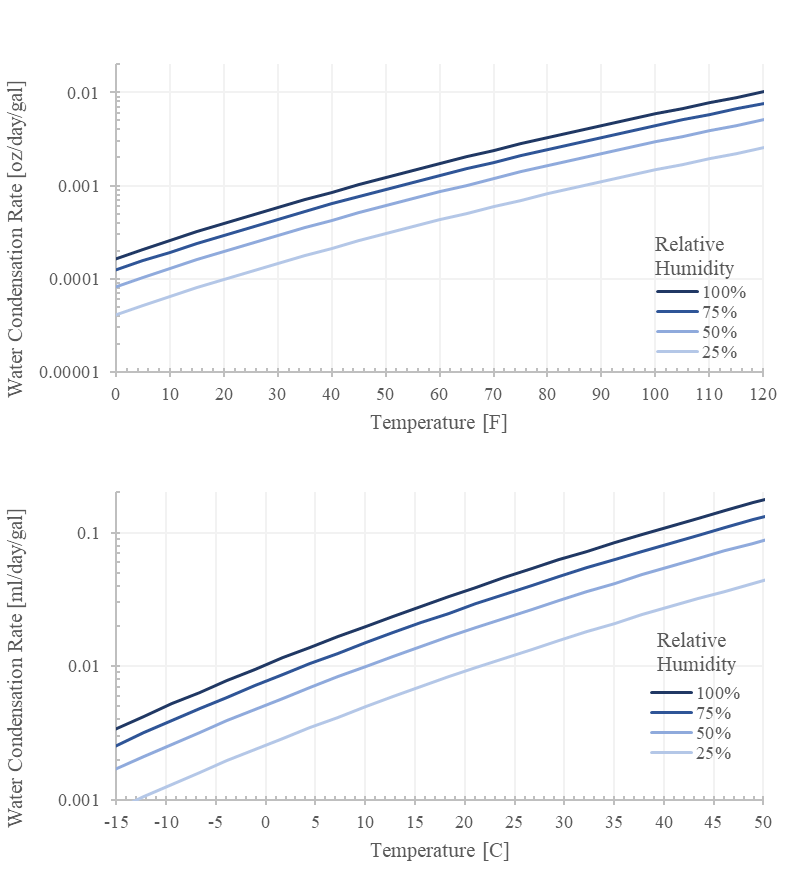
The saturation pressure (Ps) in Figure 2 is generated from the Arden-Buck approximation as an exponential function of temperature. This also indicates the pressure at which boiling occurs (e.g. 212 F at sea level pressures of 14.69 psi; and 200 F at 10000 ft with a pressure of approximately 10 psi).
Design a worst case scenario
Let’s pick a scenario where a nearly empty 25 gallon tank completely condenses the water vapor. Plus there is a complete air exchange/recharge of hot and humid (120 F and 100% relative humidity) air once per day. How much water is generated?
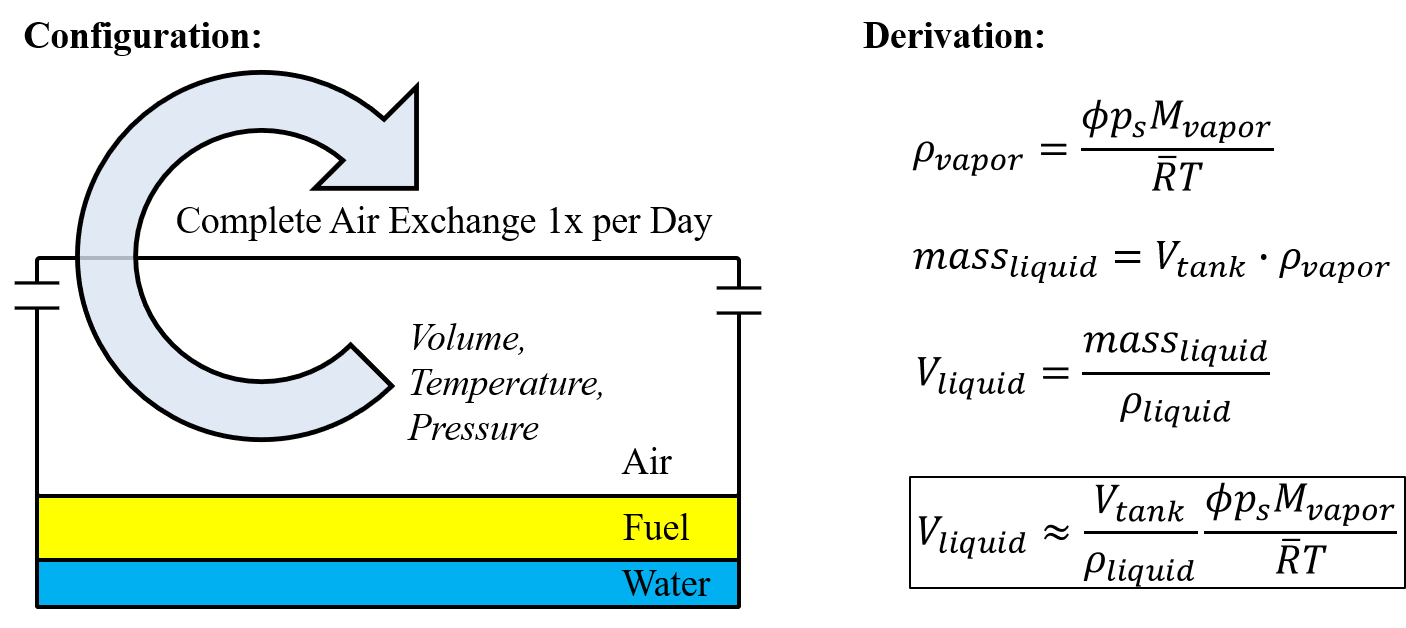
The answer is about 0.25 oz (7.5 ml) per day. Consider it one cupped-hand of water, or about a 2.5″ spot of water, or 0.75 seconds of fuel at 10 gal/hr. That’s enough to fully grab your attention.
The rate scales linearly with the tank’s air volume so keeping the tank 90% full reduces the generation rate by 90%. Being in 30% humidity air reduces the rate by 70%. Doubling the elapsed days doubles the generated volume. Notice that the rate exponentially scales with temperature (ps/T is exponential).
Critically, we can bound the generation rate. For example, at 120F and 100% humidity with a 20 gallon tank, the rate should be less than 0.20 oz per day.
If you are generating more than this, chances are extremely likely that there is another mechanism responsible. Go find it.
Maximum Condensing Case with an more Realistically Vented Tank
To be continued
Cold Soak & Descent
To be continued
Piper Cherokee Airspeed Calibration
This note determines the airspeed calibration card for a Piper Cherokee aircraft. The flight occurred on 6 December 2020 near College Station with a PA-28 140. Minimal onboard equipment was used: the airspeed indicator, the altimeter, and the outside air temperature. A personal uAvionix Sentry connected to Foreflight provided the GPS derived track and groundspeed.
Using a personal algorithm, the indicated to calibrated airspeed data points were reduced and plotted.
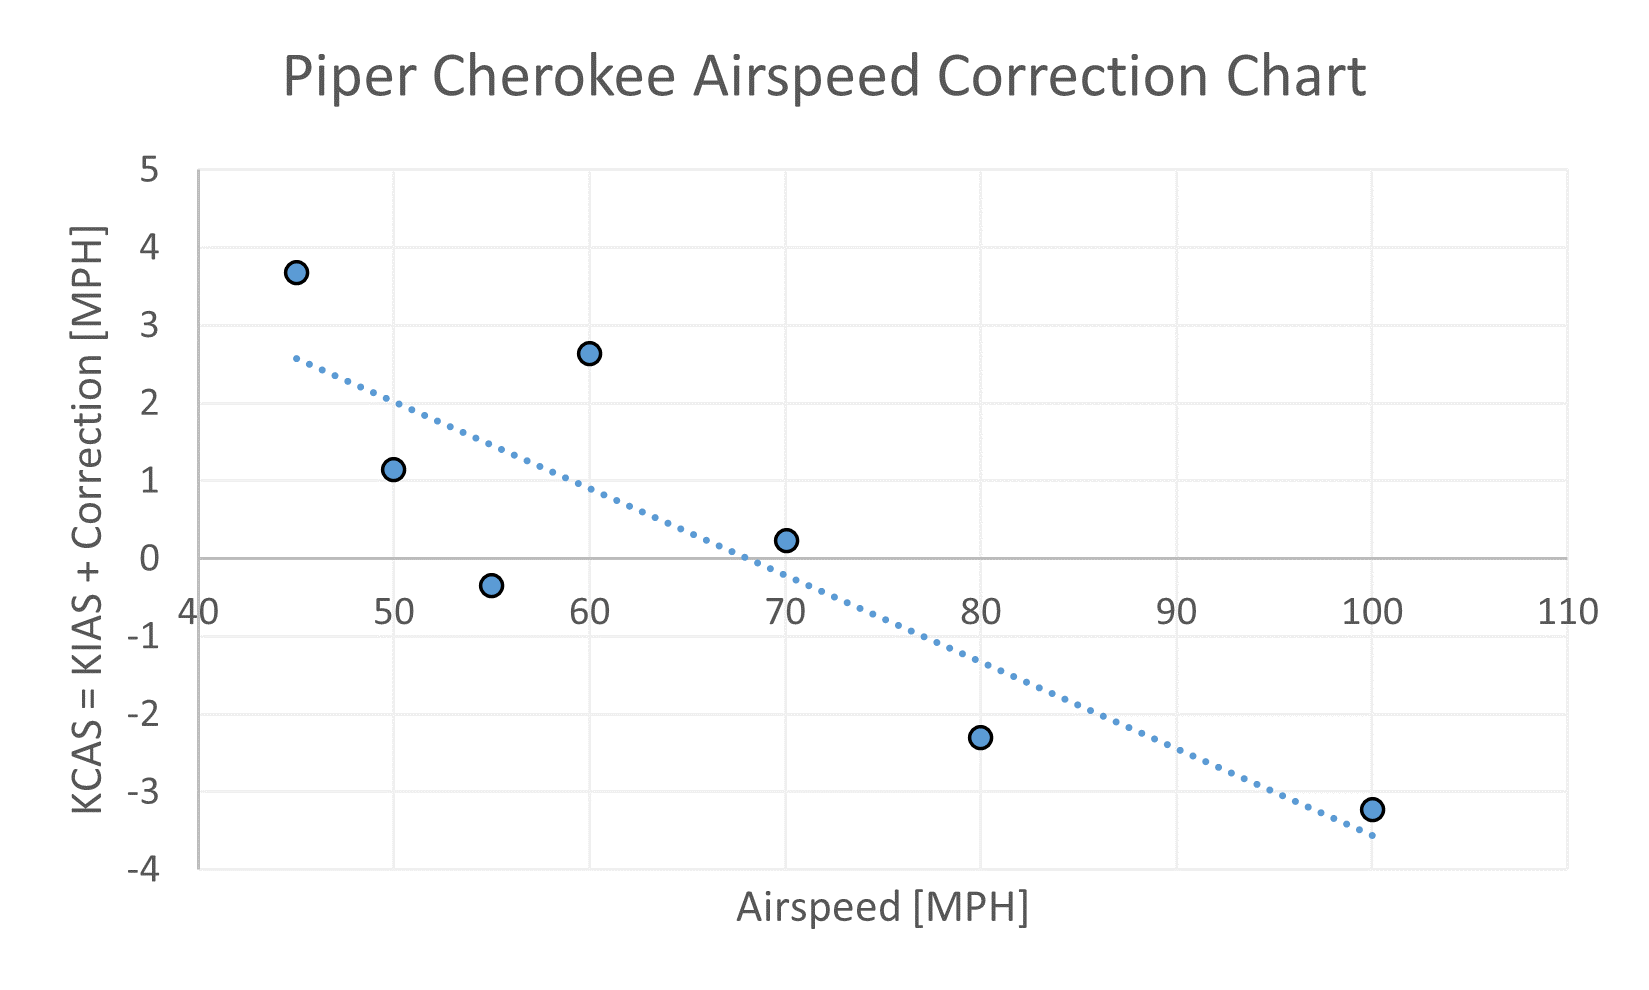
The trend is clear. At low speeds, the airspeed indicator reads too low (a common error). The errors at cruise are negative; the airspeed indicator reads too high. Only at around 70 MPH is the error near zero. Unfortunately, at the low end, there is more scatter than I hoped for. This scatter is likely resulting from the challenges of 1) precisely maintaining a specified indicated airspeed with an analog airspeed indicator, while 2) recording the average groundspeed and track. A future approach will use the raw GPS data points.
If we assume that the errors are solely resulting from errors in the static pressure (a reasonably good assumption), then we can determine the effective altitude errors associated with the static pressure error. These just barely meet the +-30 ft legal requirement at 100 kts.
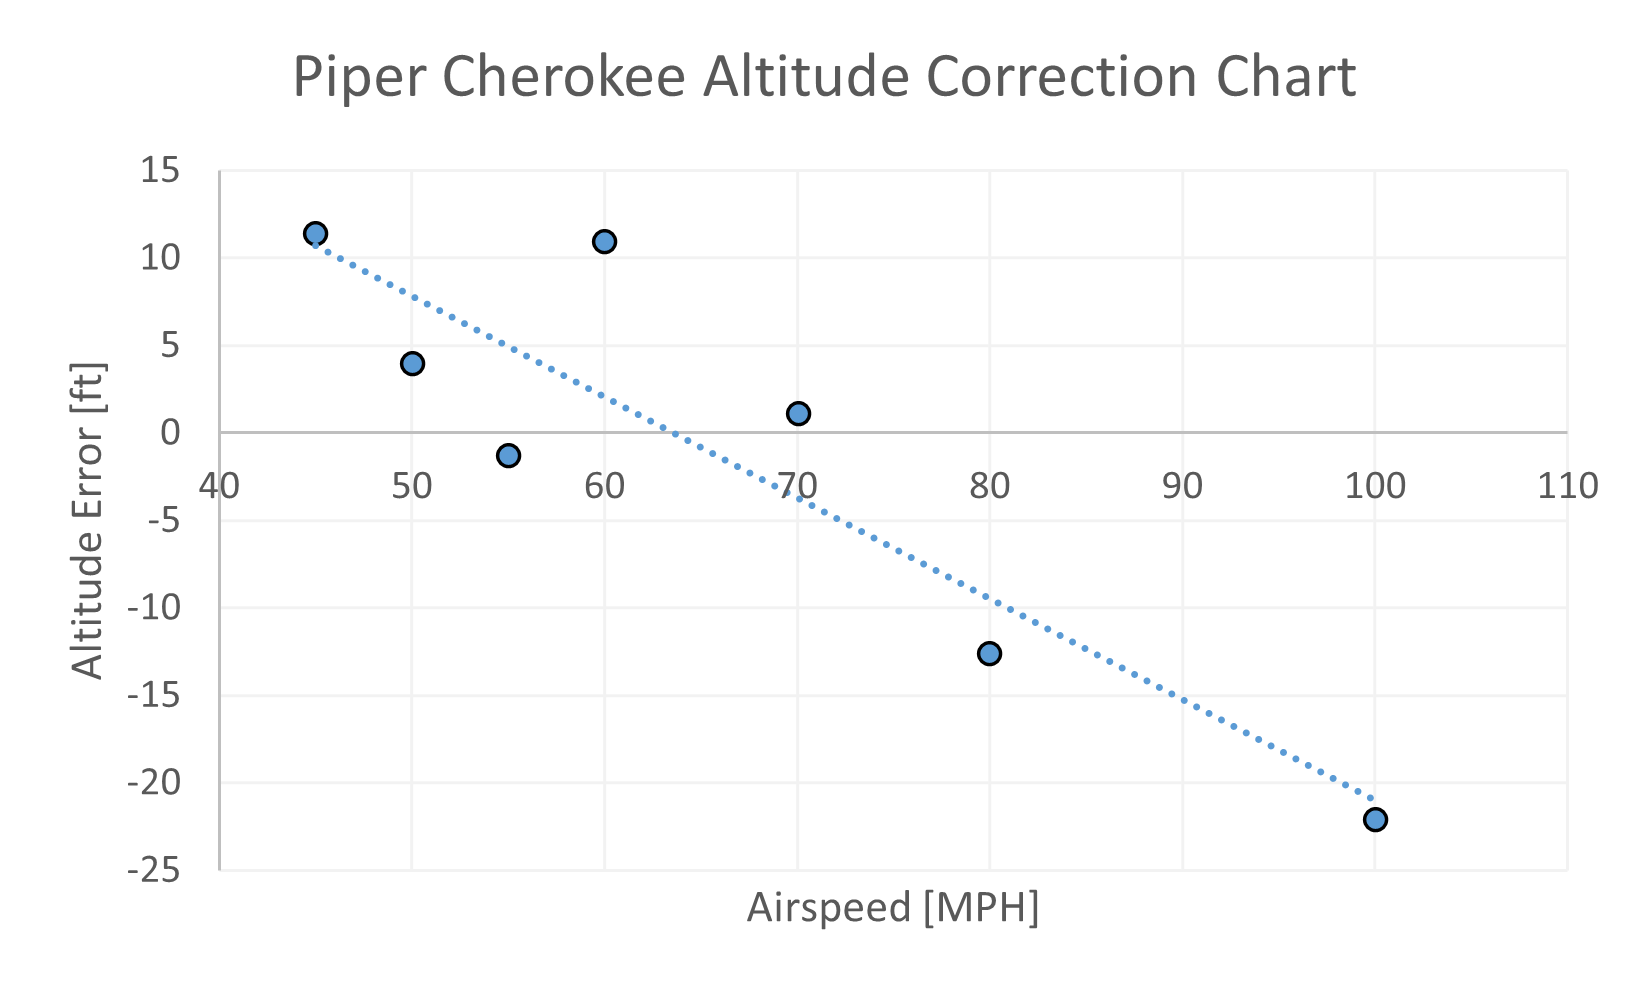
For such a short flight, we were able to determine the overall character and approximate error curves of the airspeed indicator and altimeter. A more formal program would involve multiple people, multiple data points at the same test condition, and much more flight time.
Piper PA-28 Cherokee Wing Comparison: An Aerospace Engineering Perspective
The Piper Cherokee constant chord “Hershey Bar” and tapered wings exhibit significantly different landing behaviors. In particular, the newer tapered Cherokee wings are known -two examples are at https://www.flyingmag.com/rectangular-wings/ and at pilotfriend.com– to give substantially longer landing float than the constant chord wings -all other things being equal. In this note, I will discuss 4 reasons for this behavior and allow you insight into how design choices affect performance.
A Starting Point: Geometry
For the purposes of this engineering note, we will focus on the 180 hp versions: the PA-28 180 (constant), PA-28 180 Extended and PA-28 181 (tapered). The geometries taken from three POHs are in Figure 1:
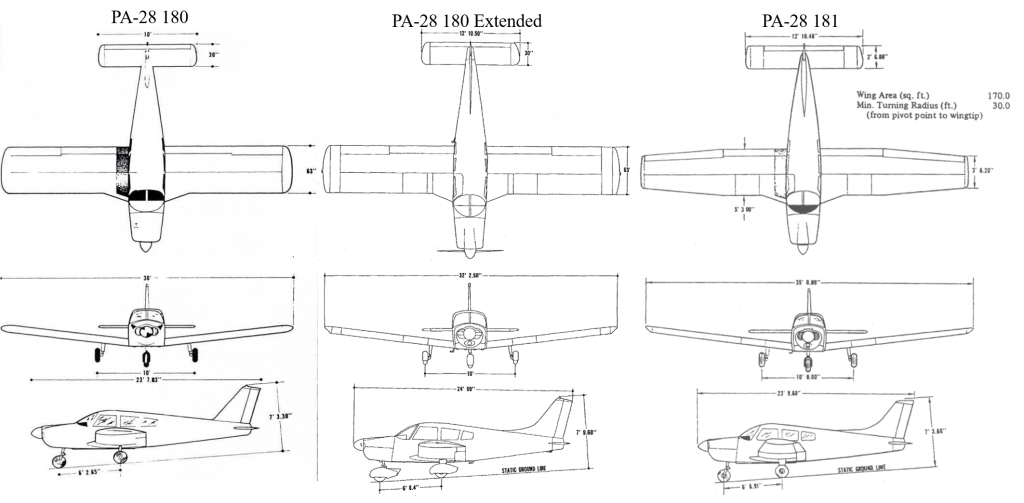
The aircraft are essentially identical except for the wing planform, so for more insight, zoom into the wing shapes with Figure 2.
Continue reading