
This is a talk for the Texas Flying Club.
Author Archives: co
Rotationally Symmetrical Tank Volume
This note demonstrates how to quickly find the volume of a rotationally symmetrical enclosure. I find this approach useful for estimating and designing tank volumes. As an example, you can quickly find the volume of a toroidal tank with a 1 inch circle revolved about a line 2 inch from the circle’s center is slightly under 10 cubic inches (precisely π squared).
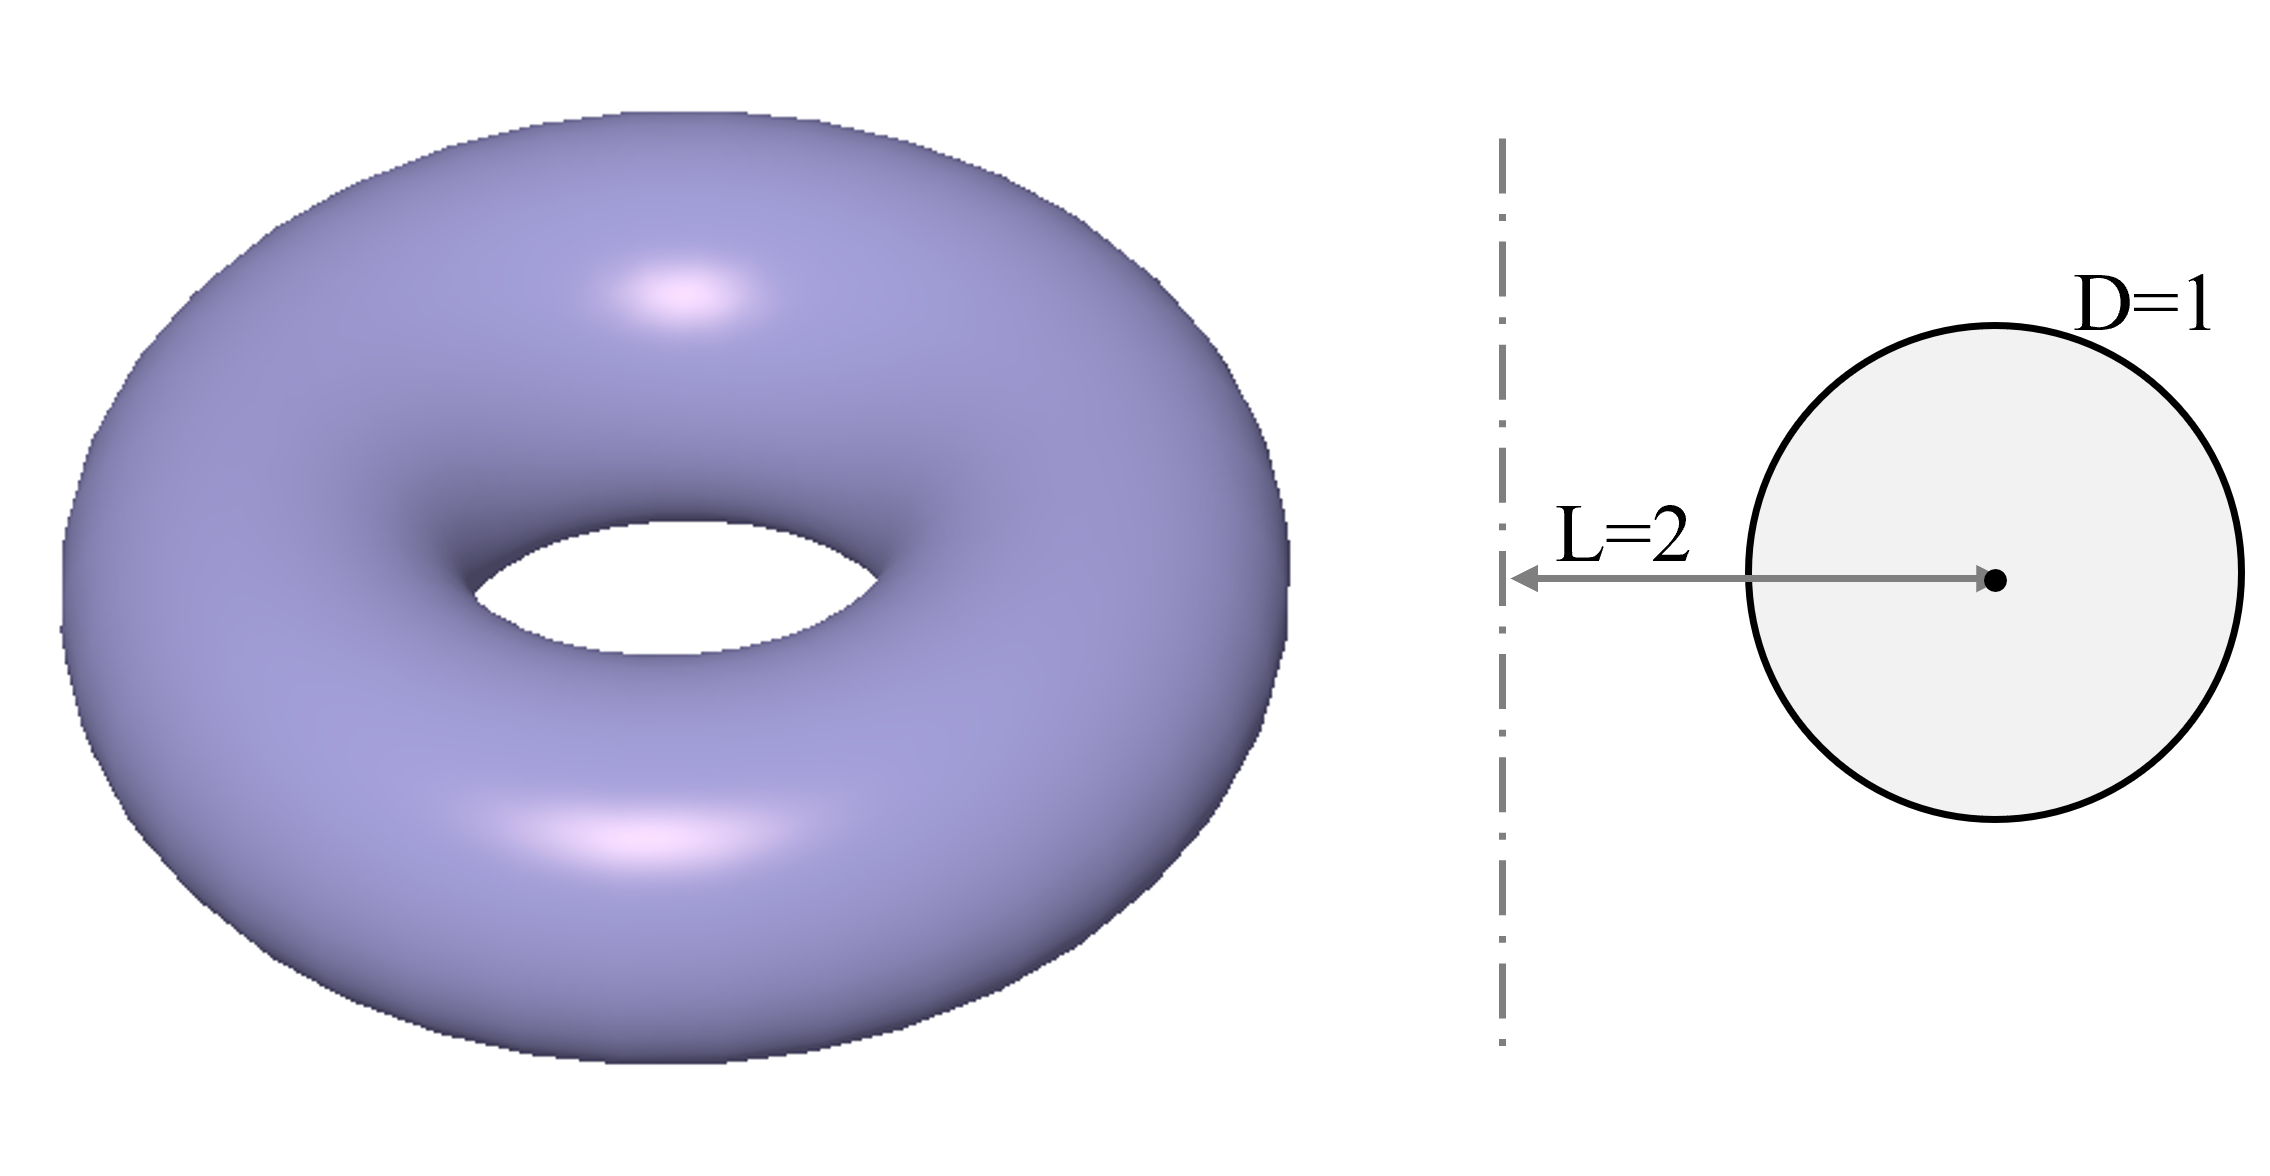
The equation is simple: Volume = 2π·A·L, where A is the area of the revolved cross section and L is the distance from the rotational axis to the center-of-gravity of the cross sectional area. For the torus, the area is 2π·πD2/4·L which simplifies to π2D2L/2. Neat and fast.
Here’s a design application: develop an equation for elliptical ended cylindrical tanks to hold precisely G gallons. Using the revolution equation in the figure below gives a total volume of V=πR2(h+4/3·b).
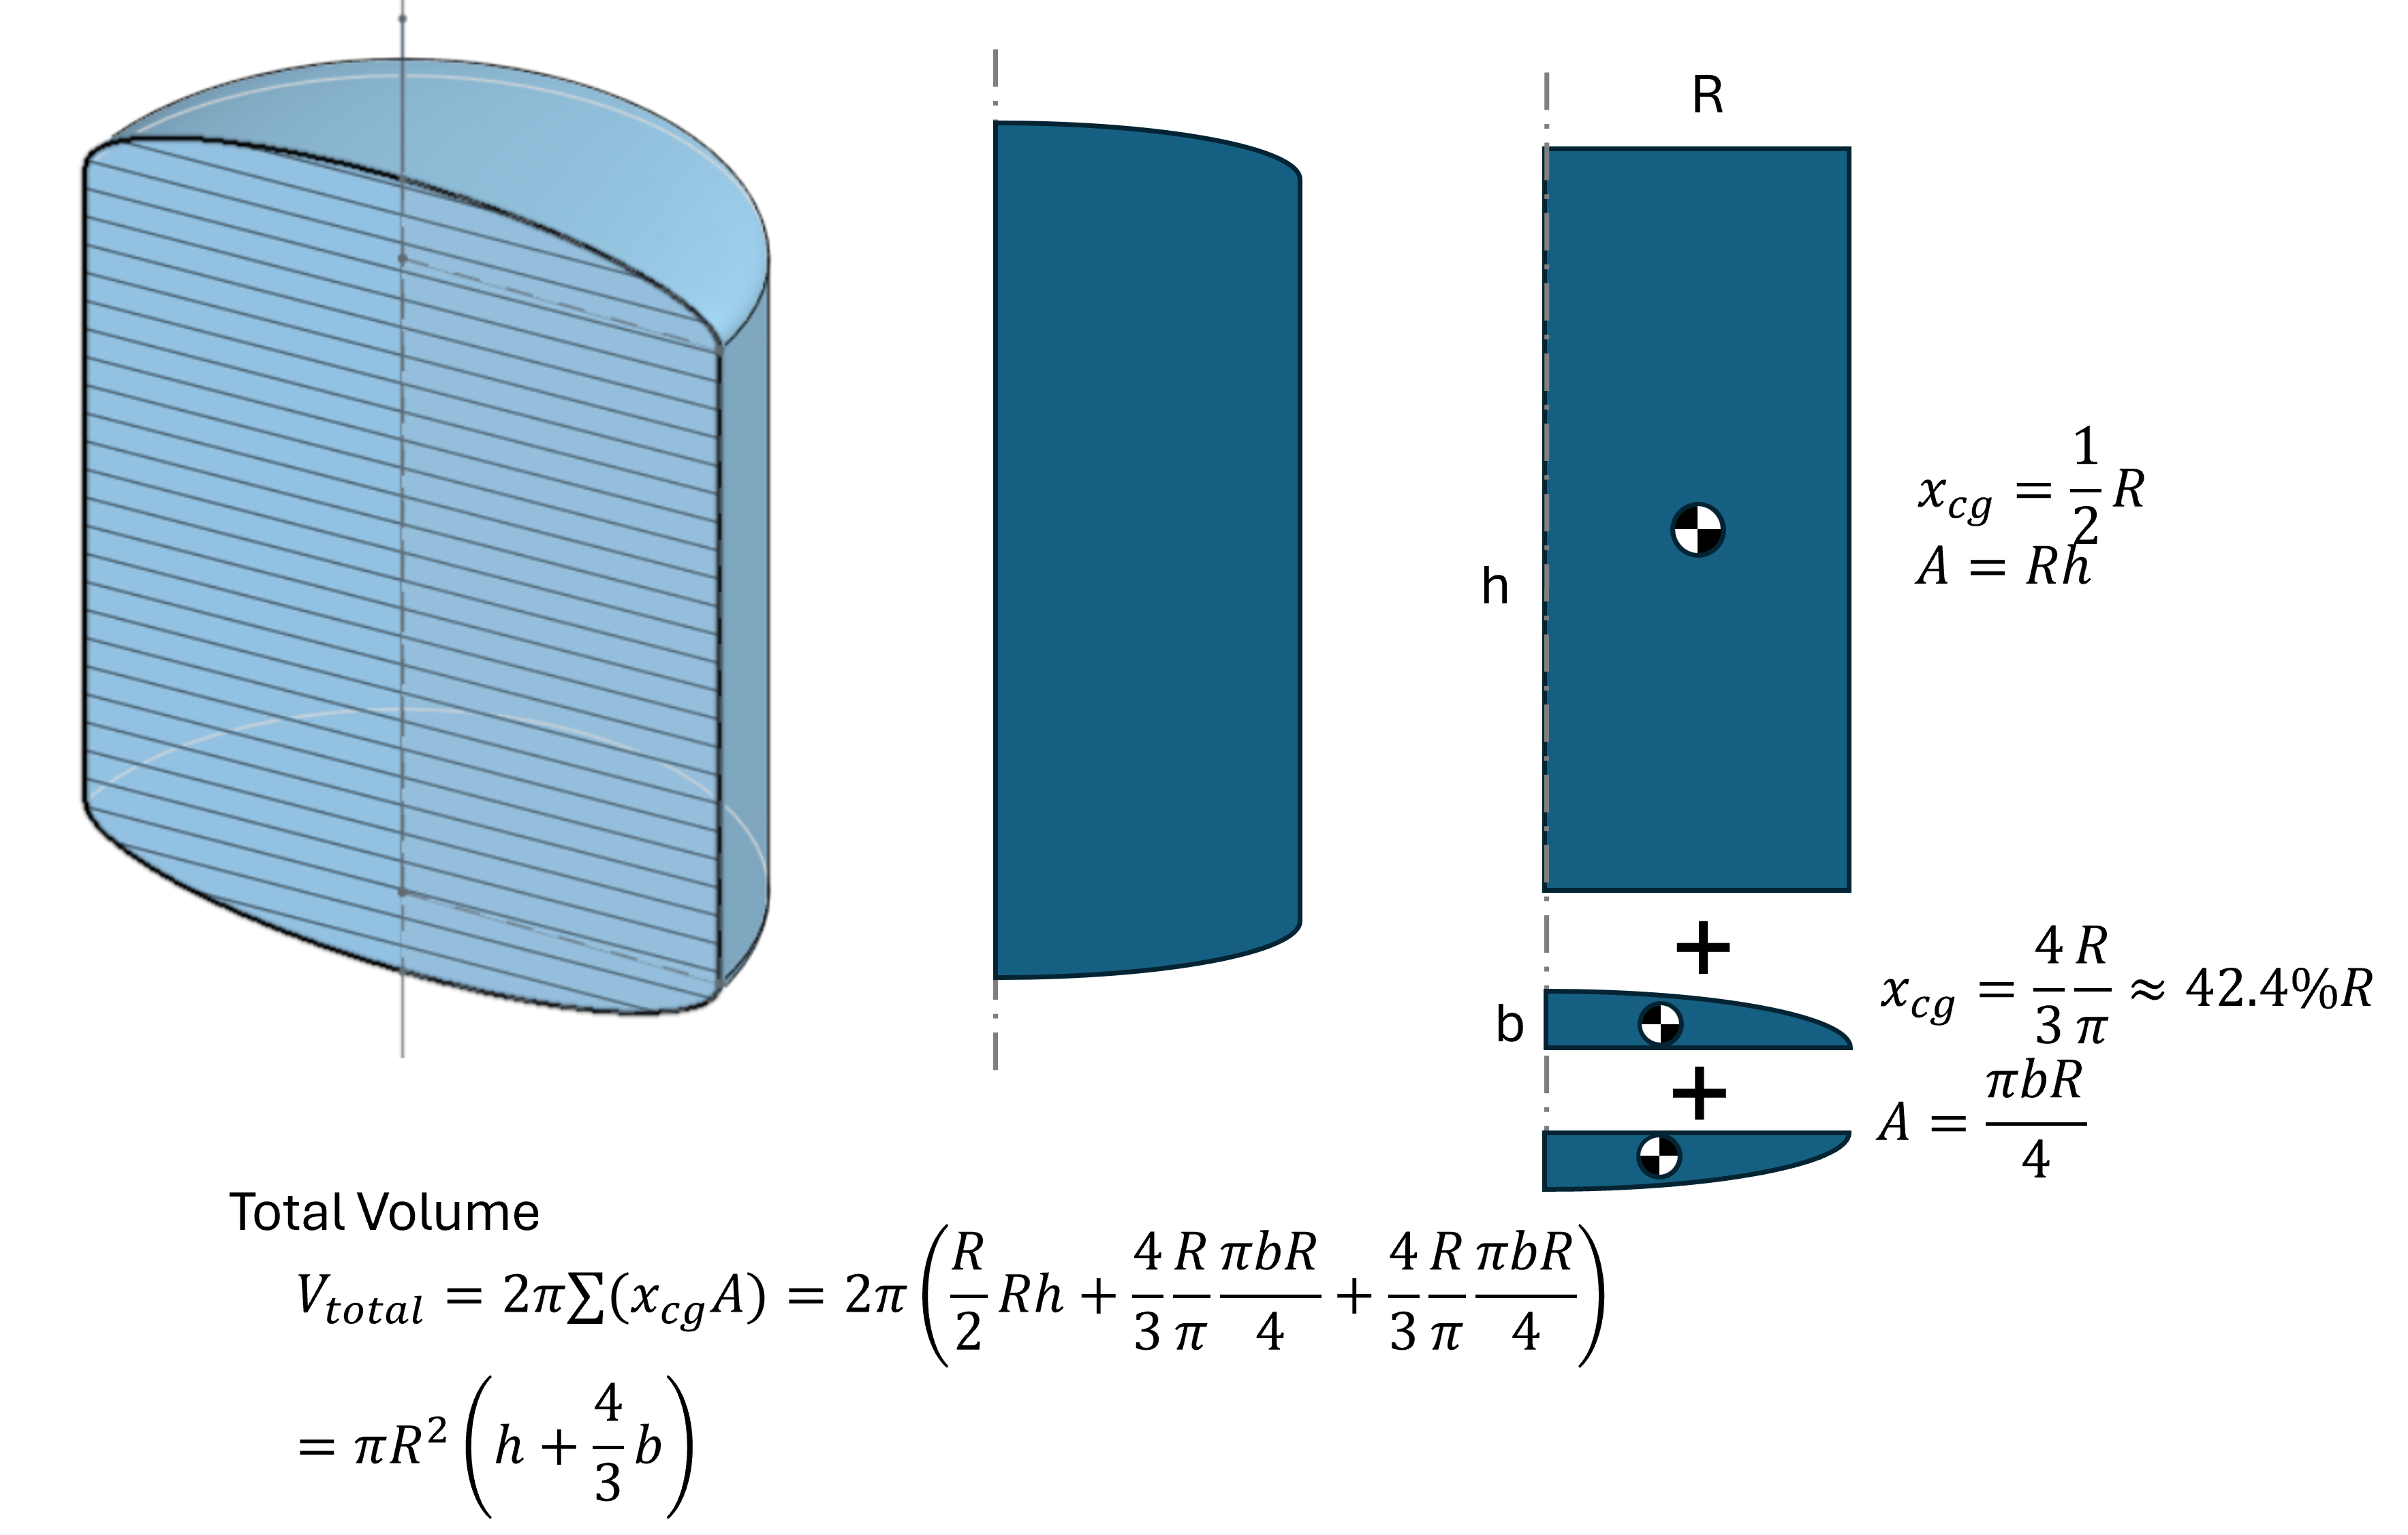
Now conversion to gallons is a linear transformation with 231 in3 per gallon.
This approach is also useful for crazy, bizarre, strange, and otherwise normal volumes of revolution. For instance, you can now find the volume of a specialty triangular o-ring seal.
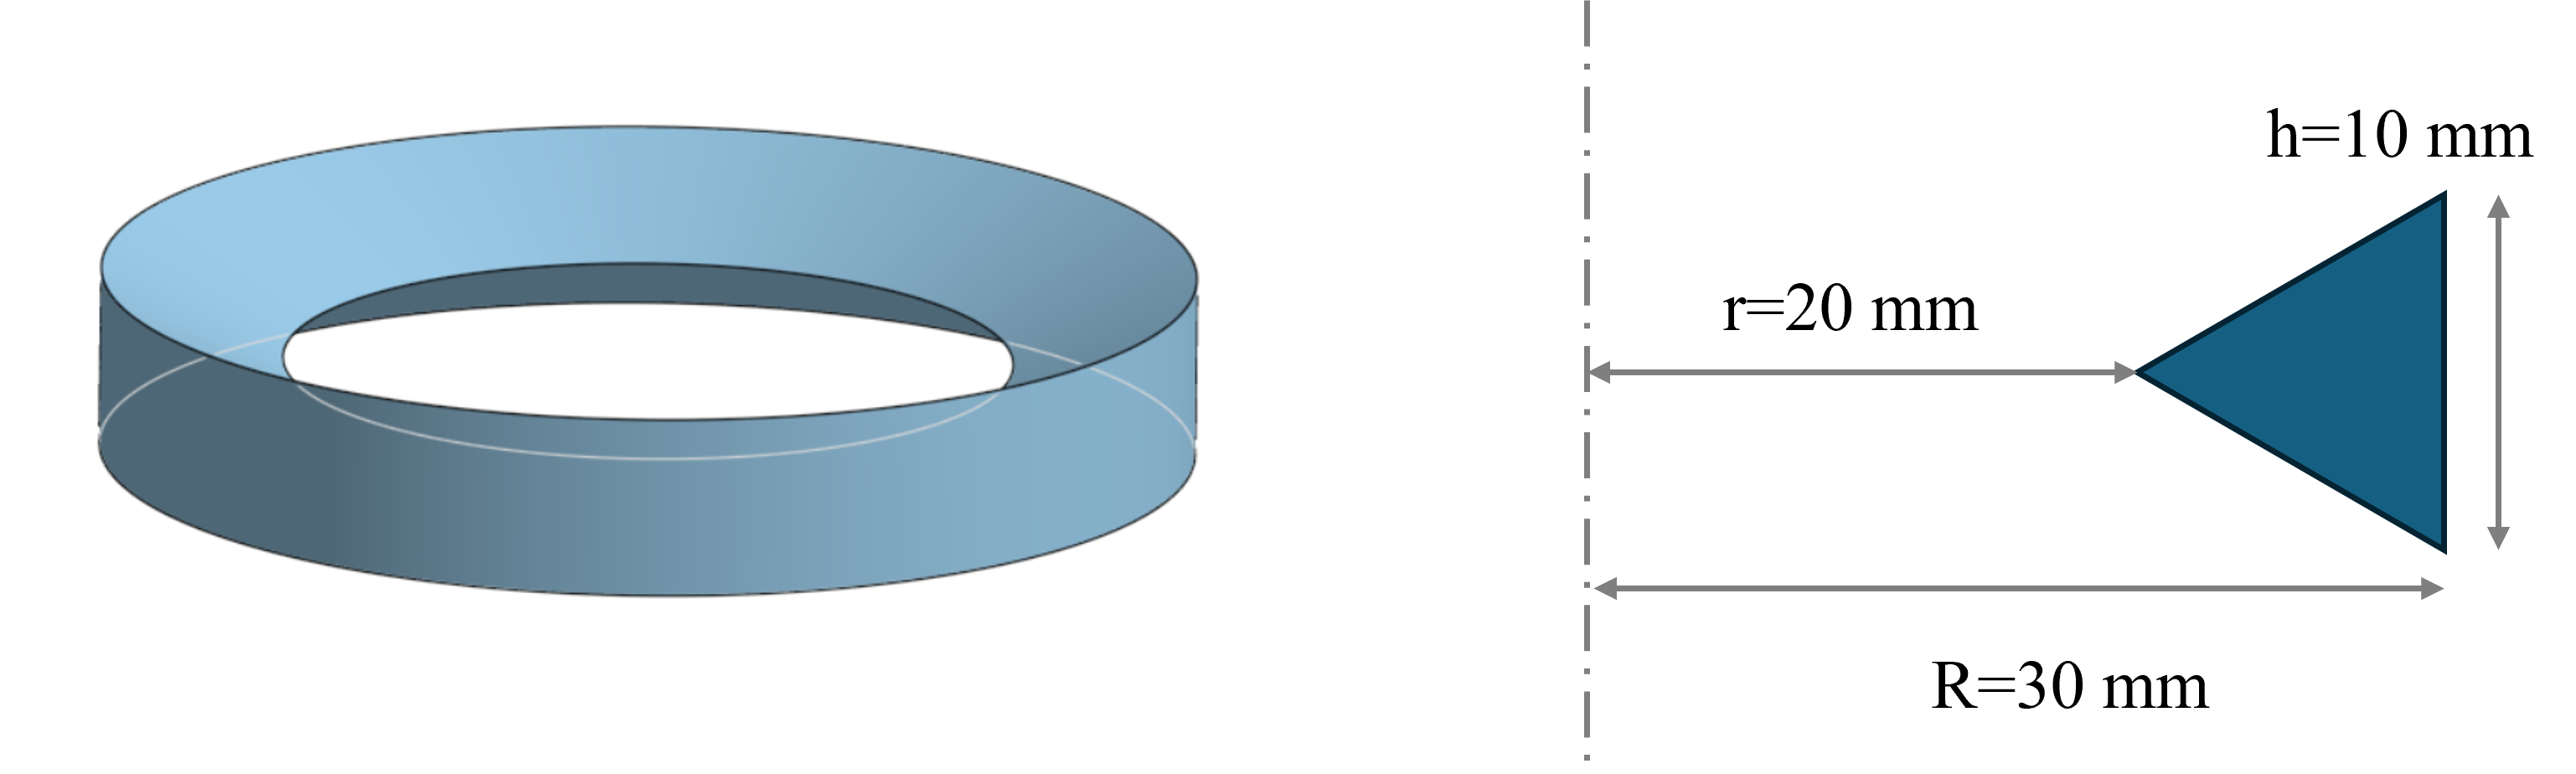
The triangular cross sectional area is half the base times height, so 50 mm2. The center of gravity of a triangle is 2/3 the way from the tip to the base, so that’s 6.6 mm. The total distance from the axis to the CG is 20+6.6 = 26.6 mm. Multiply and you obtain: Volume = 2π 50 * 26.6 = 8377 mm3
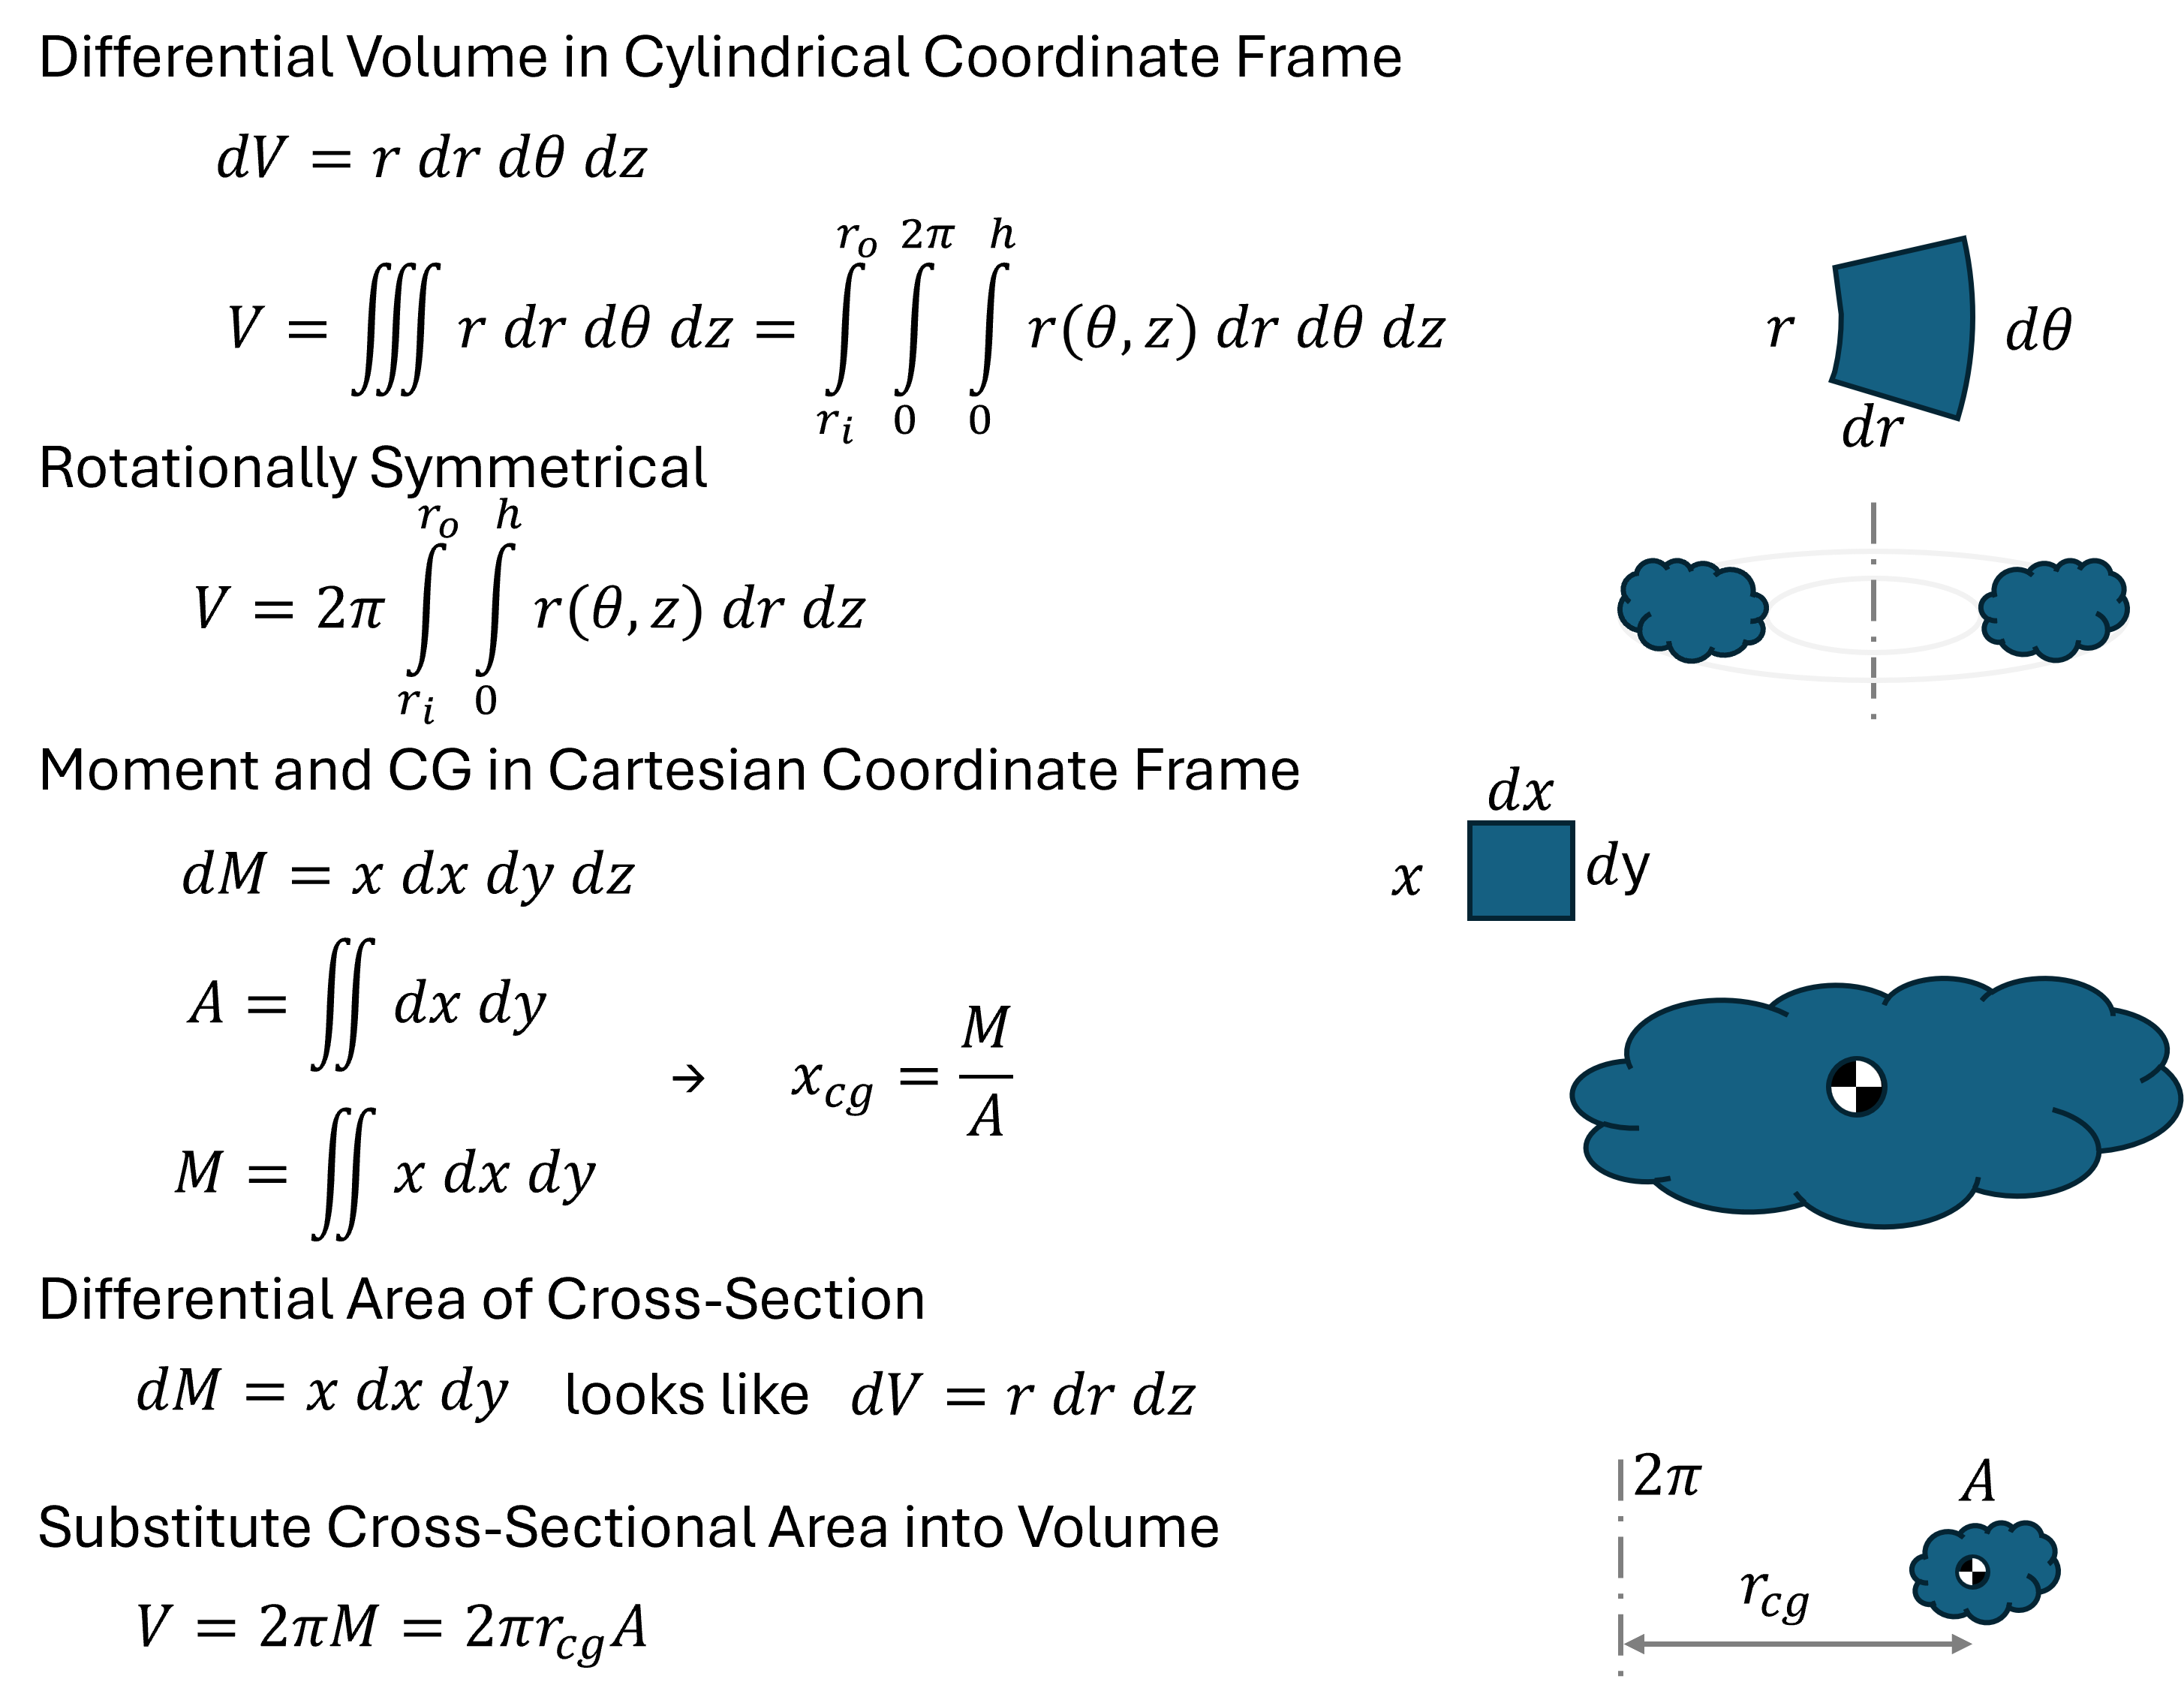
Why does this work?
The key trick here is recognizing that in cylindrical coordinates, the differential volume is dV=r·dr·dθ·dz, which appears to contain the moment equation dM=x·dx in a 2D Cartesian frame. A derivation is presented below.
Can ChatGPT pass an undergraduate aerodynamics exam?
These and more questions are investigated in this note, as I channel my inner Professor O’Neill as inquisitor in a digital oral defense. My notes are added as <comments>.
Oral exam portion
I asked ChatGPT to explain drag. This isn’t terribly wrong until the induced drag discussion.
Q: "Explain aerodynamic drag from a technical point of view"

Aerodynamic drag is the force that opposes an aircraft's motion through the air. It is caused by the difference in pressure between the front and rear of an aircraft, as well as the friction of the air molecules against the surface of the aircraft. It can be broken down into two main components: parasitic drag and induced drag. <Good>
Parasitic drag is caused by friction of air molecules against the surface of the aircraft, and includes skin friction and form drag. Skin friction is caused by the friction of air molecules against the surface of the aircraft, while form drag is caused by the shape of the aircraft.
Induced drag is caused by the production of lift by the aircraft's wing. As the wing generates lift, it also generates a swirling wake of air behind it, which creates a low pressure area. This low pressure area pulls the tail of the aircraft backwards <Totally wrong>, creating drag.
I would say that this discussion is no worse than most undergraduates who have not taken an aerodynamics course. ChatGPT needs to study Low Speed Aerodynamics, available here. Induced drag is caused by the production of lift and does create a swirling wake of air that convects downstream. The wake is not necessarily a low pressure area, so ChatGPT is not correct. The following statement about pulling the tail backwards is completely nuts; induced drag is not conceptually applied at the aircraft tail.
Continue readingCherokee 235 Tip Tanks and Fatigue
A previous analysis indicated that the POH fuel-tank recommendations reduced the wing root bending moment. This note attempts to quantify the lifespan impact of the estimated maximum 15% reduction in bending moment.
This video by Airframe Components provides an excellent visual understanding of the PA-28 and PA-32 spar structures. Please review this video before continuing.
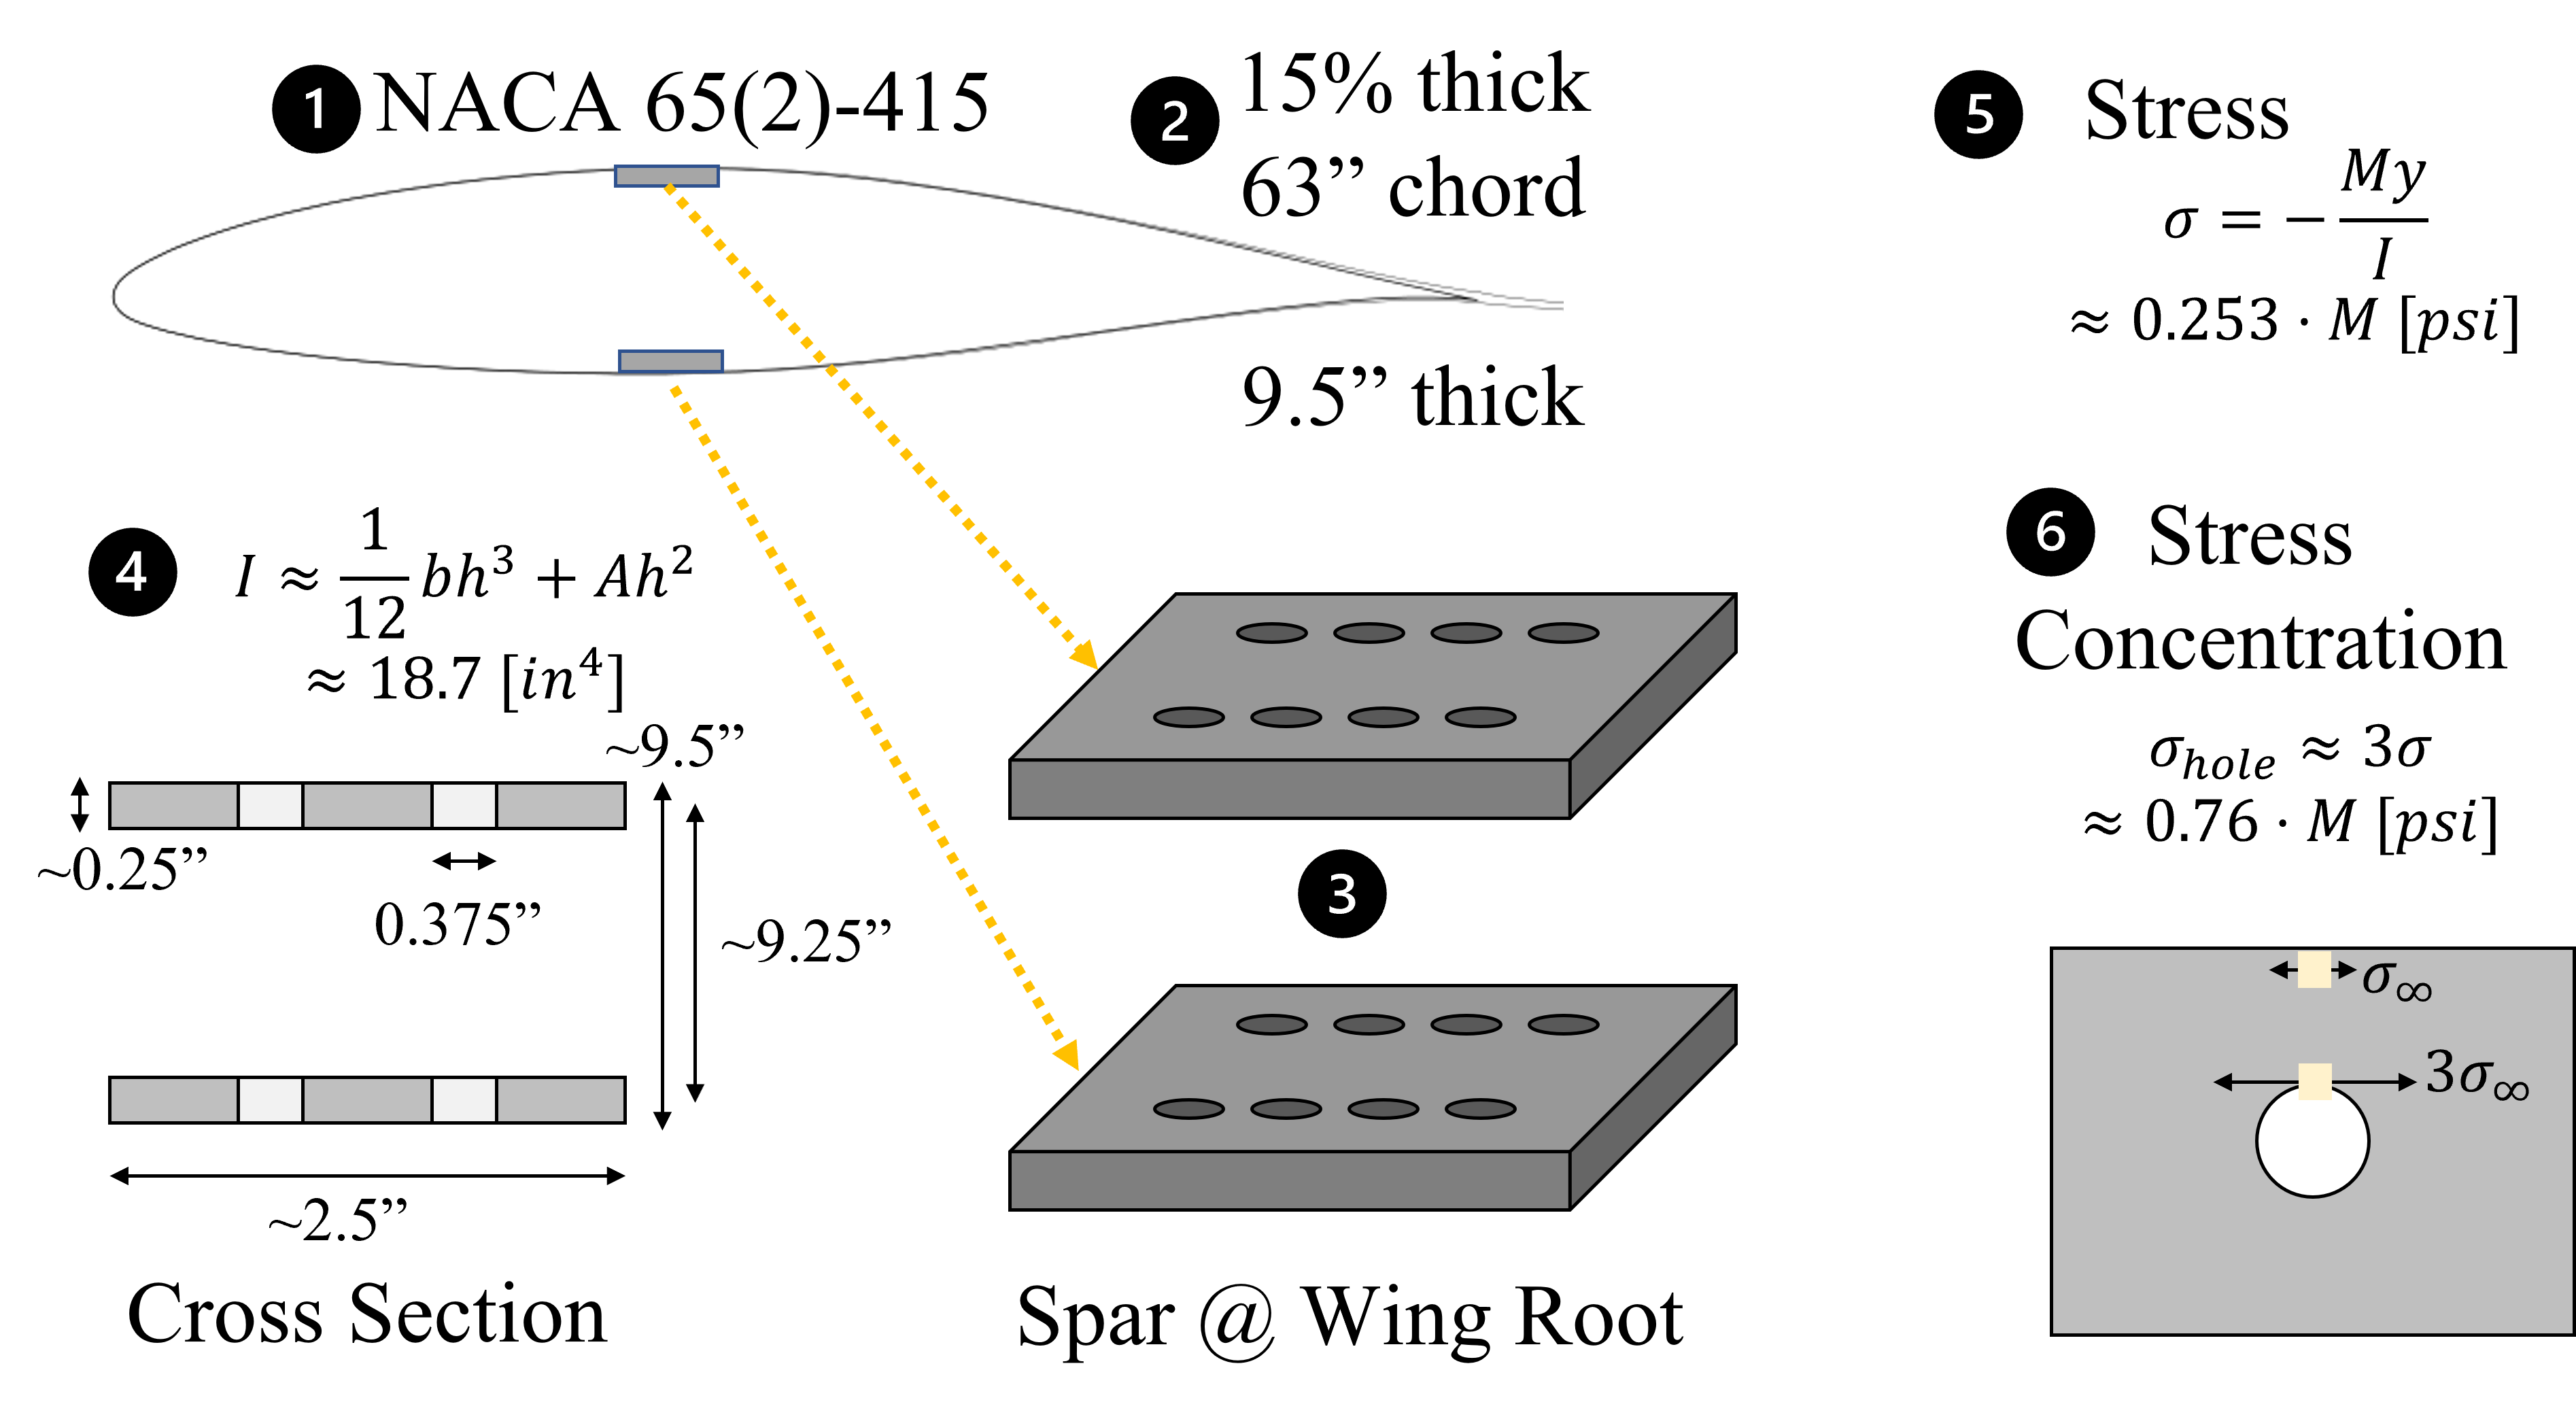
The PA-28 aircraft use the NACA 65(2)-415 airfoil (c.f. Piper PA-28 Cherokee Wing Comparison: An Aerospace Engineering Perspective) with wing spar attach points as illustrated in Figure 1. With the spar at the maximum 15% thickness of a 63 inch chord, the spar height is about 9.5 inches. The moment of inertia is about 18.7 [in4] resulting in a stress of 0.253 [psi] per moment [in-lb]. However, the presence of holes significantly increases the stresses at the bolt holes by about 3x.
Aluminum has the unfortunate mechanical property that all loading -regardless of the stress magnitude- contribute to the metallic lifespan.
To be continued.
Cherokee 235 Tip Tanks & Wing Bending Moments
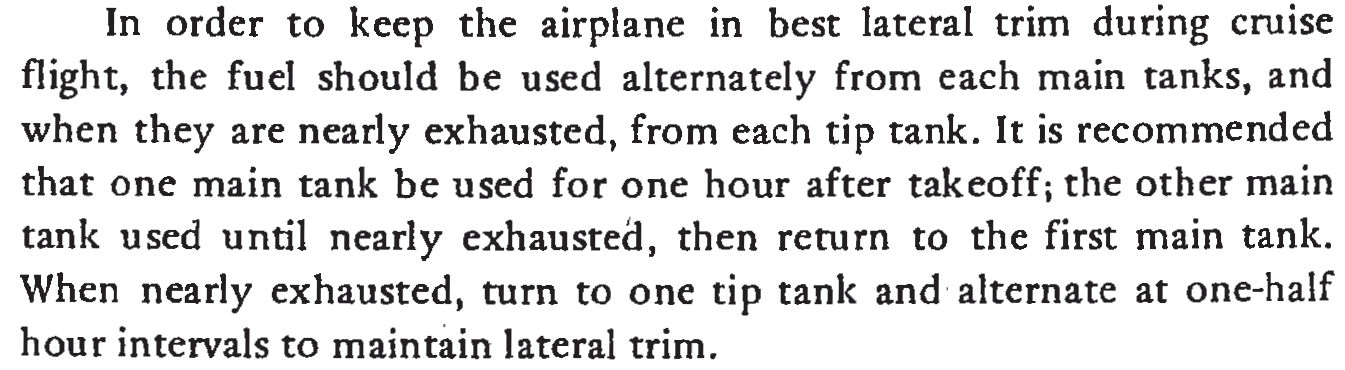
The Piper Cherokee PA-28-235 recommends the use of the tip tanks last. The purpose of this note is to estimate the reduction in wing root bending moments associated with this strategy. The PA28 model has a known AD history with wing root cracks; reducing the bending reduces the stress and increases the structural life. The POH for a C model says:
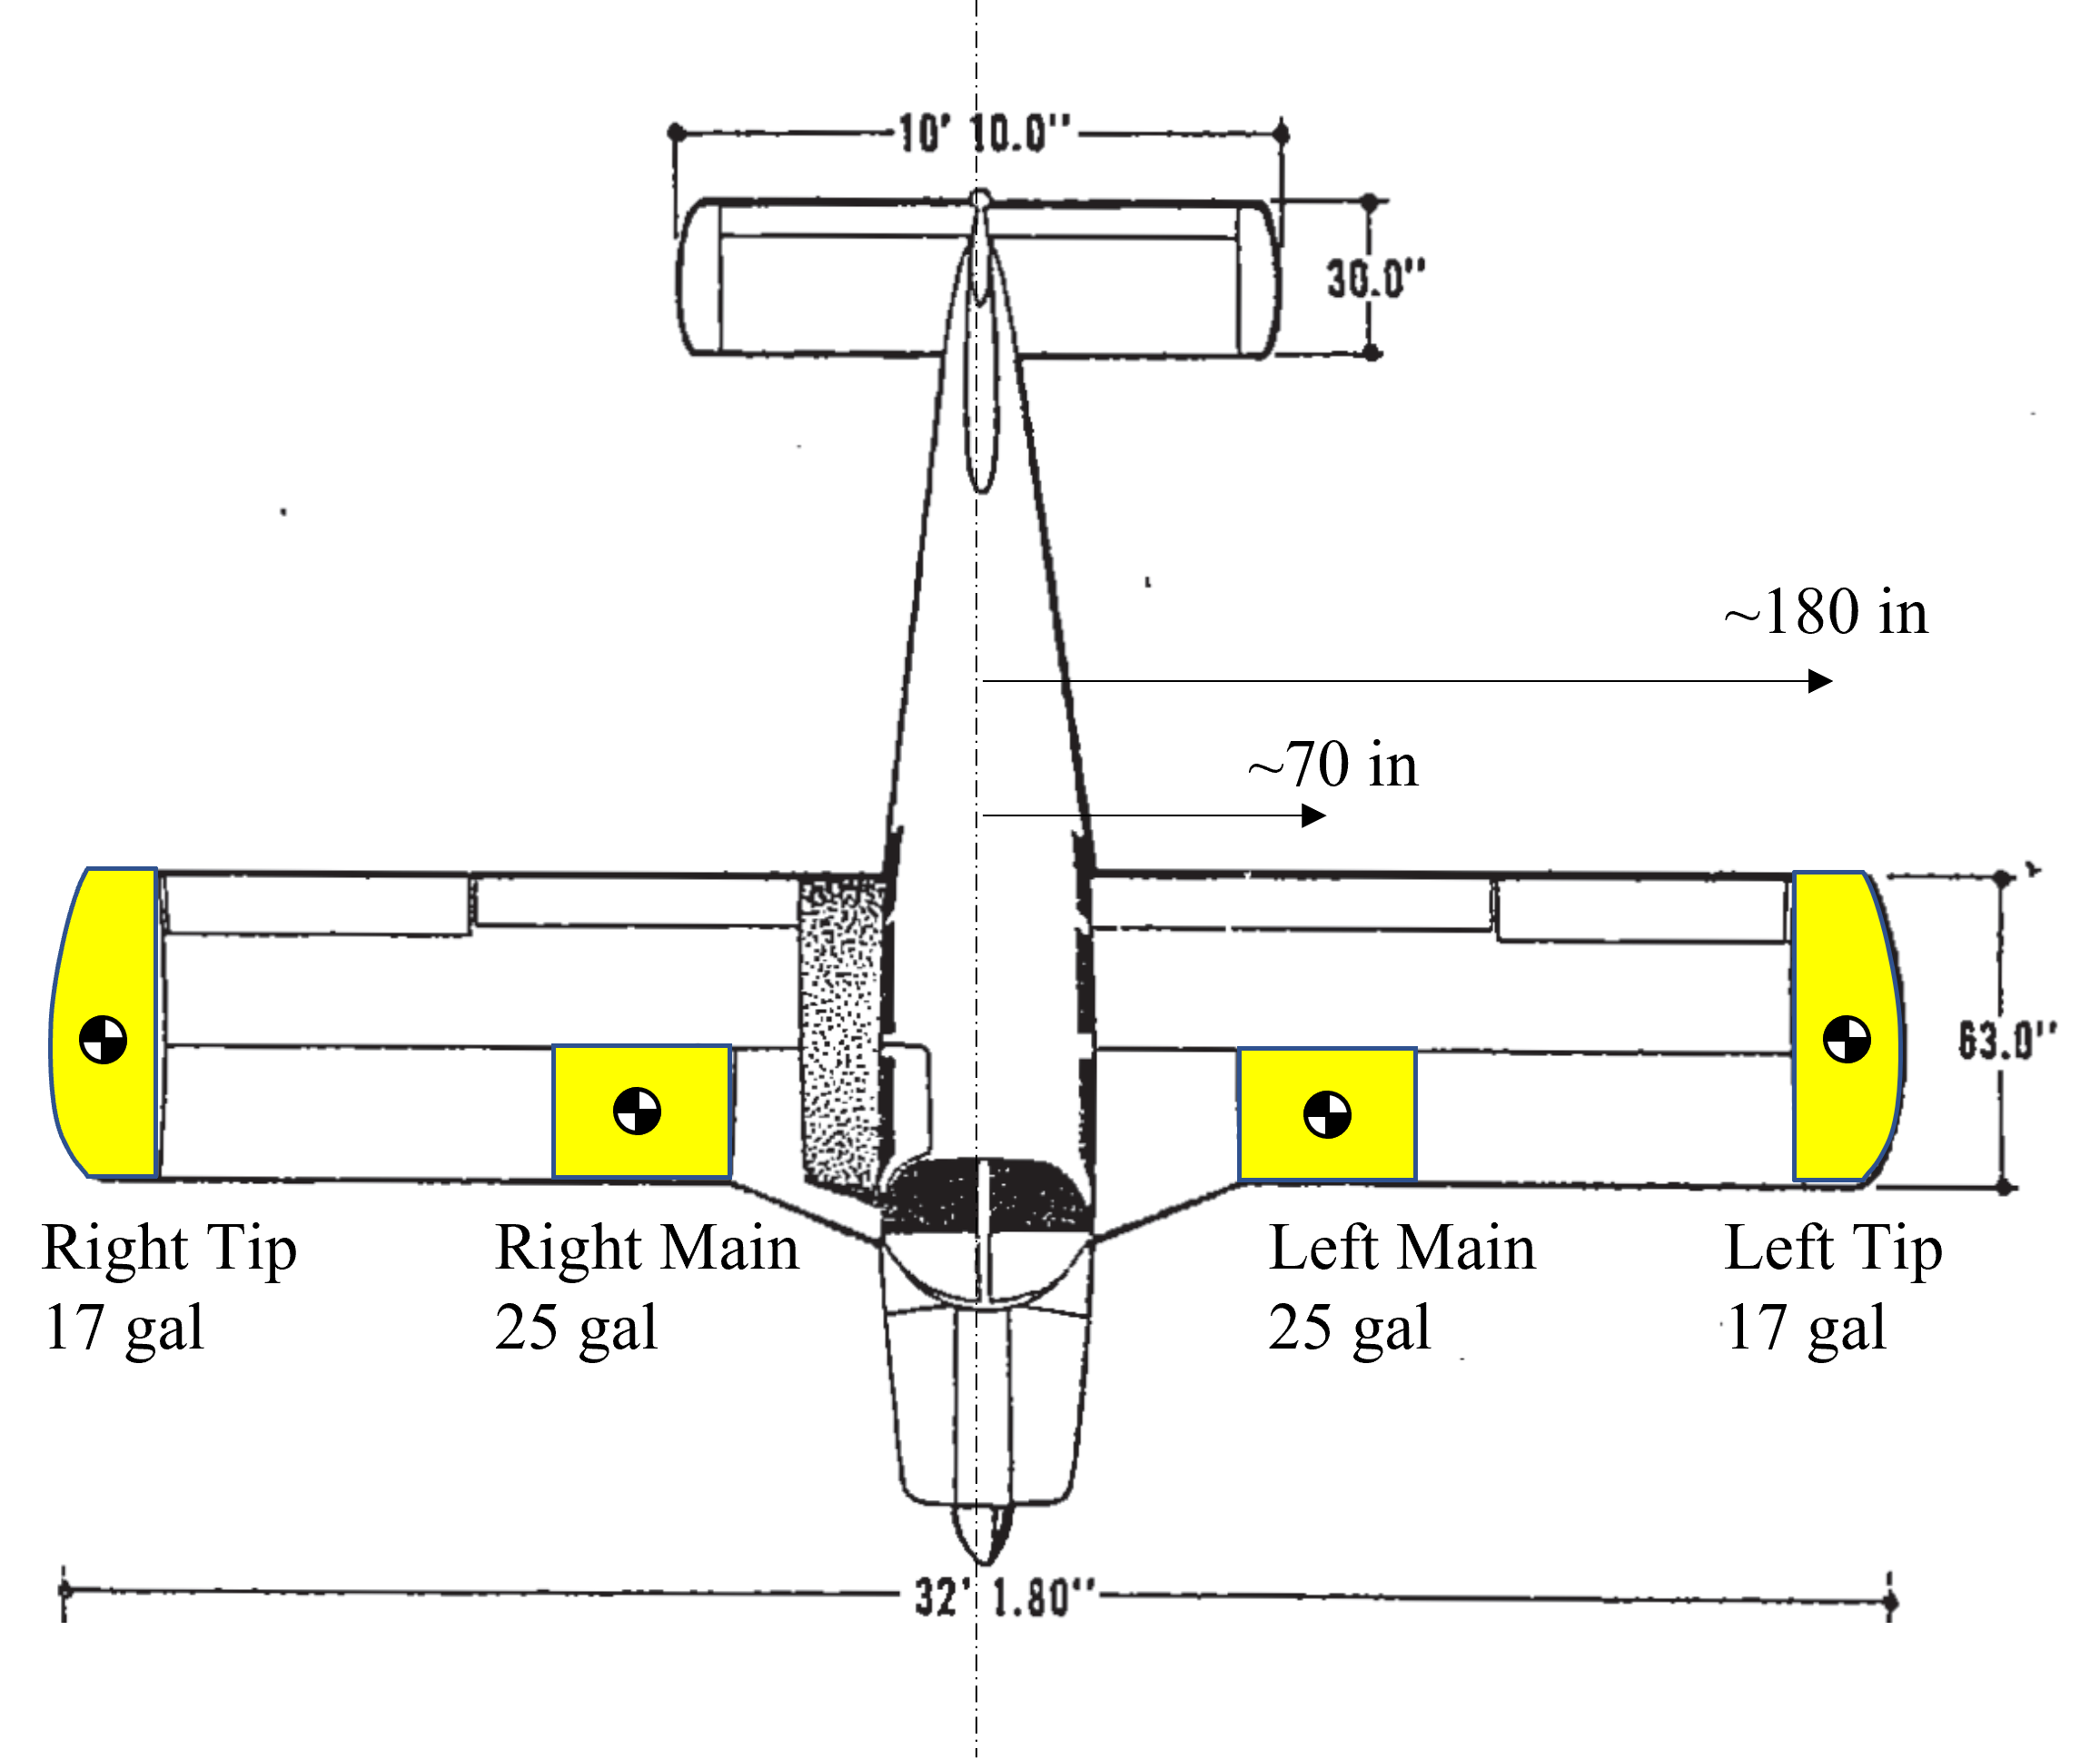
To familiarize yourself with the fuel available on the aircraft, the planform view of the aircraft from the POH with fuel tank overlays is illustrated in Figure 1. The aircraft has 4 tanks: two 25 gallon main tanks and two 17 gallon tip tanks for a total of 84 gallons of fuel. The main tanks are approximately 70 inches outboard from the centerline and the tip tanks are approximately 180 inches outboard.
Aerodynamics: Using the process described in https://charles-oneill.com/blog/cherokee-tapered-wing-float/, the wing’s effective spanwise aerodynamic center is located at approximately 43% of the span. To remain conservative, we ignore the structural weight of the wing. The simplified configuration is given in Figure 2.
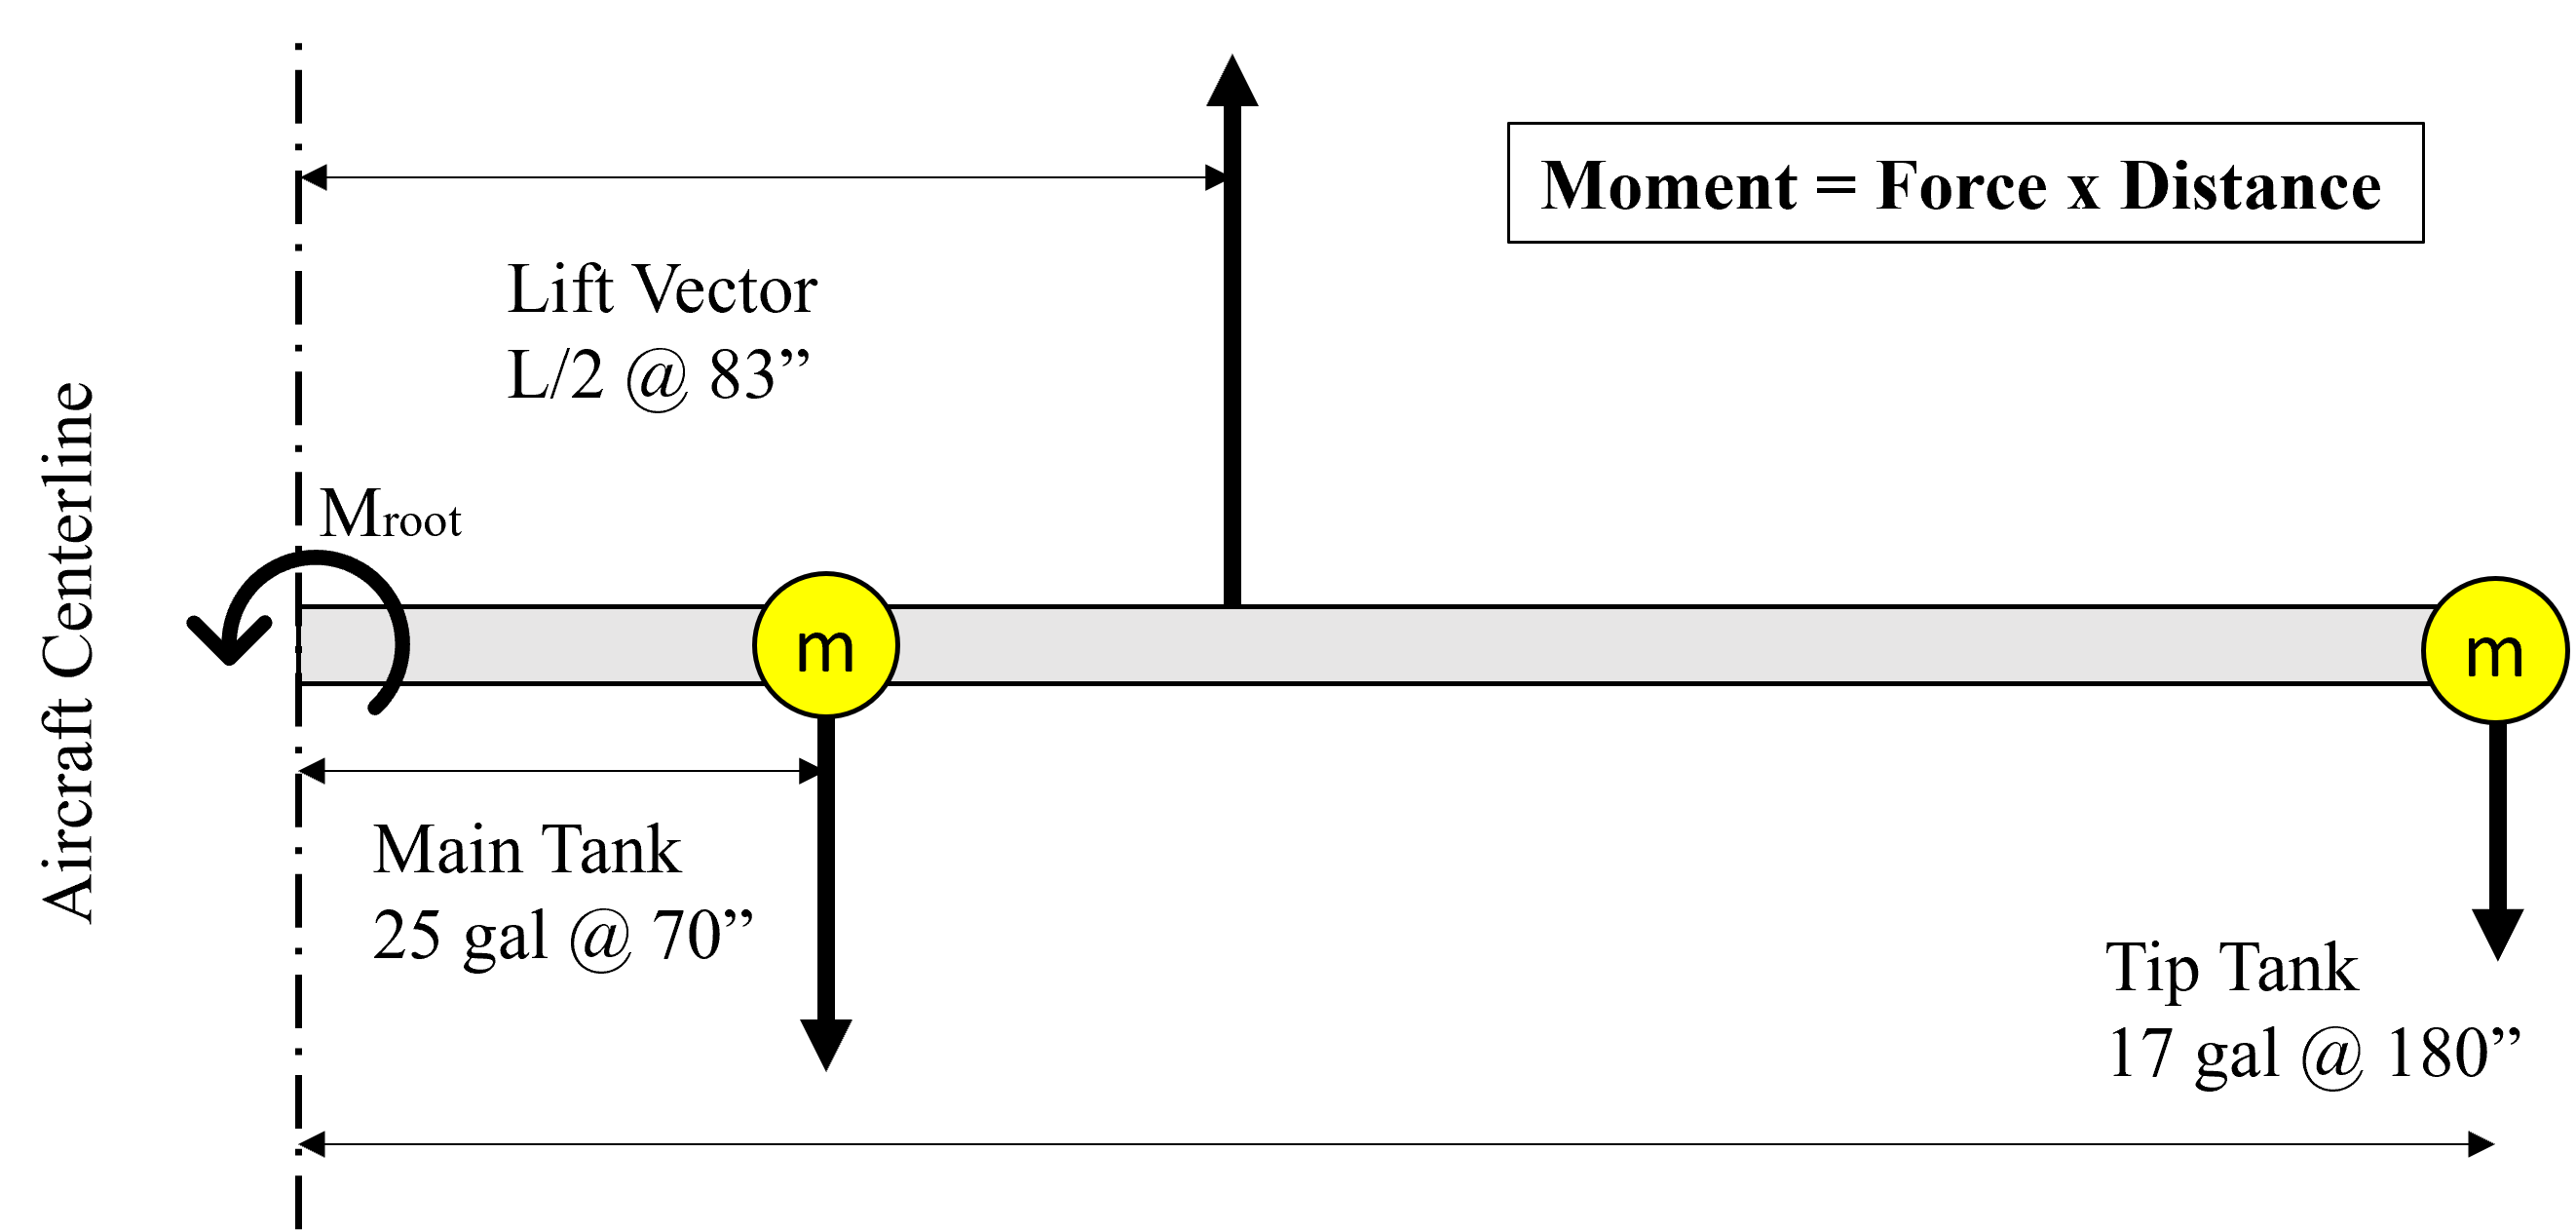
Summation of moments about the root (left side) gives the following equation. When substituting for the wing panel’s lift (L/2) and the weight of fuel, the overall moment at the wing root is

Plotting this wing root bending moment (per g) over the aircraft’s envelope provides a visual comparison of the differences in loading and operational techniques. All feasible loading and operating conditions lie within the gray shaded region. The worst case (red color) is a light 150 lbf -but perhaps not so bright- pilot with VFR minimum fuel and a maximum payload to achieve gross weight of 2900 lbs; notice that the Cherokee does NOT appear to have a zero fuel weight limitation (ZFW). On the other extreme, a light 150 lb pilot with no payload results in the conditions at lower left, where the POH loading suggestion (main 1st, then tips) is the lower black line. The green line shows the results when tips are fed first until dry and then the mains are fed.
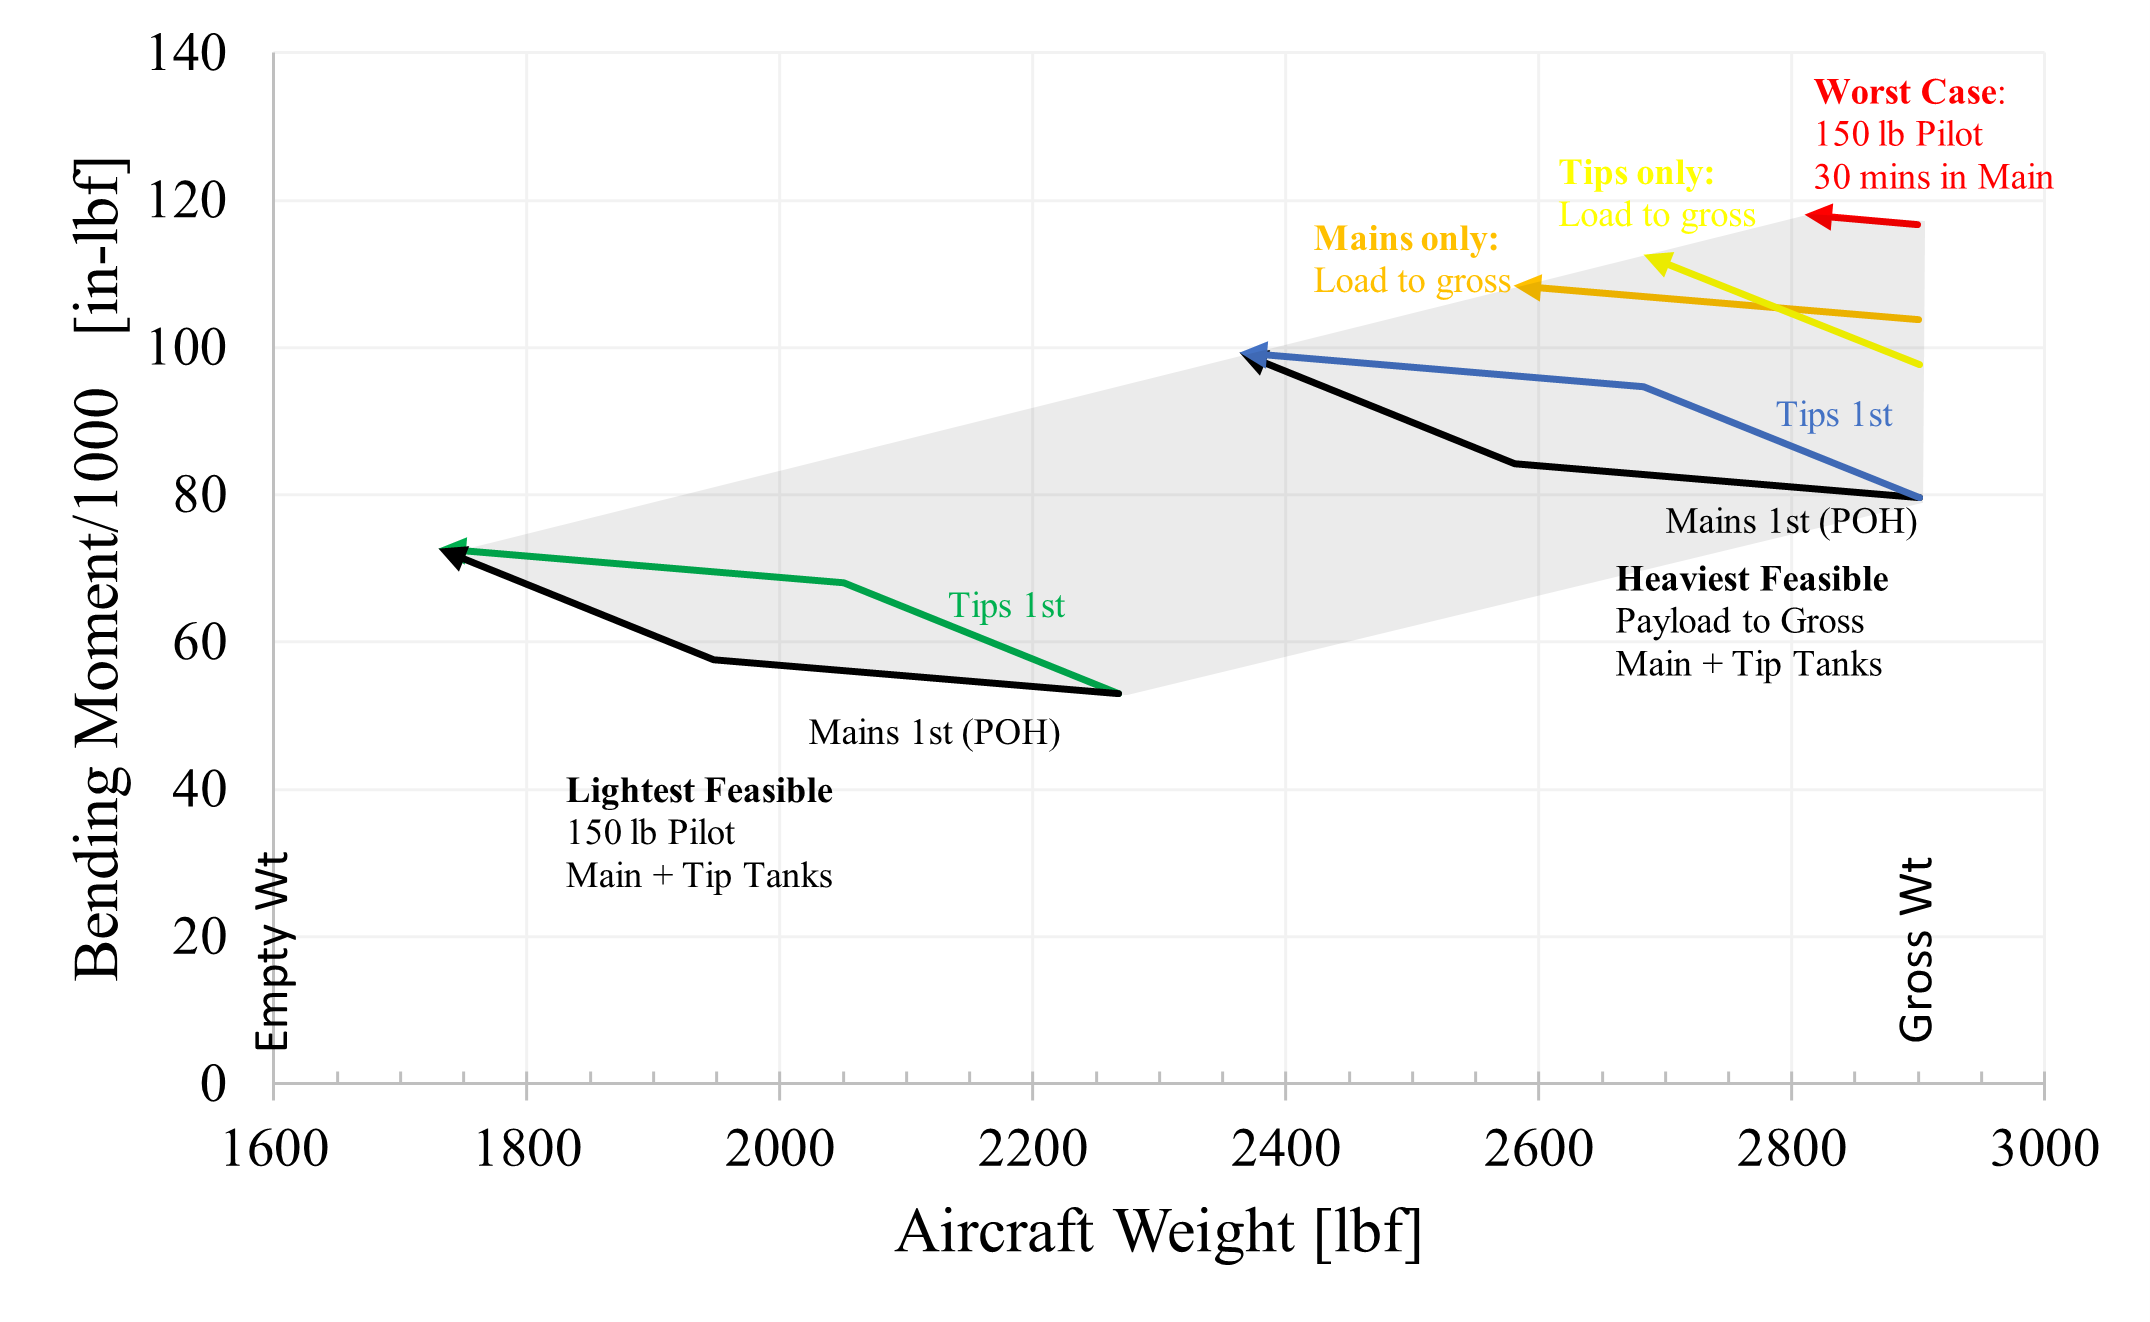
Conclusion 1: Adding fuel reduces wing bending at the root. This immediately shows shows that the tip fuel is almost 5 times more effective at reducing the bending moment per gallon.
Conclusion 2: Each gallon of main fuel is structurally equal to a reduction in payload weight of 4 pounds.
Conclusion 3: Each gallon of tip fuel is structurally equal to a reduction in payload weight of 21 pounds. Adding fuel tip tanks (17 gallons) acts to reduce fatigue stresses similar to reducing the payload weight by 360 pounds. This is not a negligible amount.
Conclusion 4: The maximum benefit of feeding the mains before the tips is approximately a 15% reduction in bending moment.
Statement 1: This analysis does NOT include the effects of maneuvering speed. Please refer to the appropriate POH for guidance and remember that Va reduces at lower weights.
Statement 2: The 15% reduction in bending moment contributes FAR more than 15% to the aircraft lifespan. 15% is in fact a substantial number. Further analysis of this fact will be conducted later (See Cherokee 235 Tip Tanks and Fatigue).
Conclusion: The Piper POH’s suggestion to use the main tanks first does have a substantial structural fatigue benefit.
Turning Inbound: A mathematical solution
When should you start your turn inbound to exactly ensure the needle will be centered? This post explains and demonstrates a quick mental math solution. First, the answer:
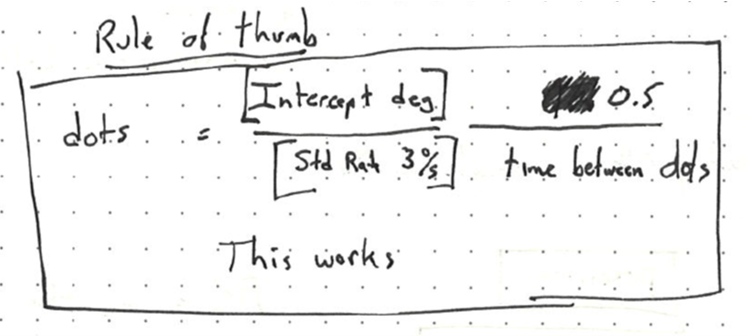
Begin your turn no later than the CDI dot corresponding to one-half of the angle to intercept divided by 3 and divided by the time to pass from one CDI dot to the next.
This solution works for turning inbound & outbound for tracking a VOR radial, a LOC/ILS, or any situation where you can count intervals leading up to a desired track.
Example
You are on a 45 degree intercept. The needle is alive and you count 4 seconds between CDI dots.

The mental math is: 45 divided by 3 is 15….. 15 divided by 4 is about 4…. Half of 4 is 2. Turn no later than 2 dots.

Derivation:

The pilot needs a quicker and more intuitive solution. We can simplify this engineering-style intercept equation with a few steps.

Thus the pilot solution in words is: Begin your turn no later than the CDI dot corresponding to one-half of the angle to intercept divided by 3 and divided by the time to pass from one CDI dot to the next.
Experimentally Developed Solution:
Full disclosure: I did not initially develop this intercept solution based on the mathematics. Rather, I experimentally flew many intercepts and developed the following rule of thumb. By a complete stroke of luck, the experimental solution happens to be exactly identical to the mathematical solution above.
Disclaimer
This solution is only meant for intuition and the mathematical understanding of intercepts. You must follow ATC, the appropriate regulations and standard operating procedures when flying. Find and train with an instructor, preferably with a CFII. No exceptions!
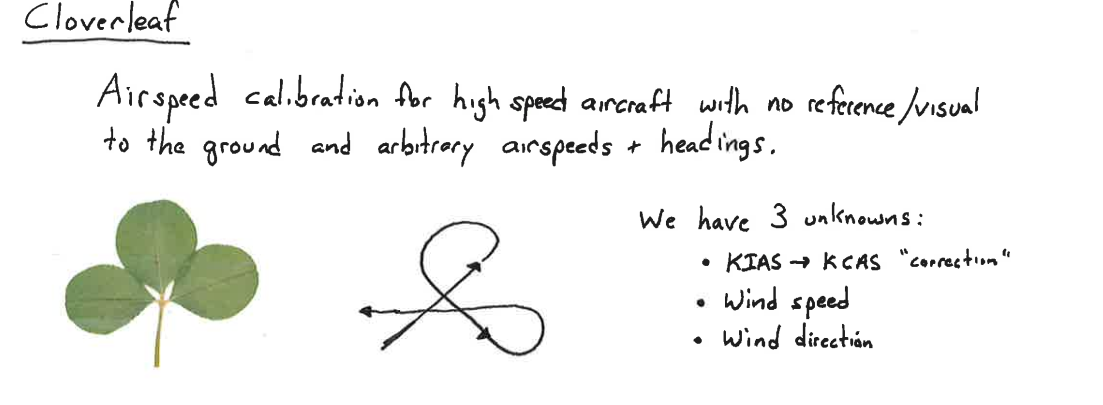
Wind Clover Airspeed Calibration
The purpose of this page is to develop and distribute a simplified airspeed indicator calibration technique and computer program tool. Calibration from indicated (KIAS) to calibrated (KCAS) is required for certified and experimental aircraft (c.f FAR 23.1323 and FAR 25.1323). There are many techniques and flight test approaches available; however, the mathematics of generating a calibration chart or card can be daunting. This page provides a FREE self-contained airspeed calibration tool for Windows computers useful for subsonic aircraft with minimal calculation and with minimal equipment.
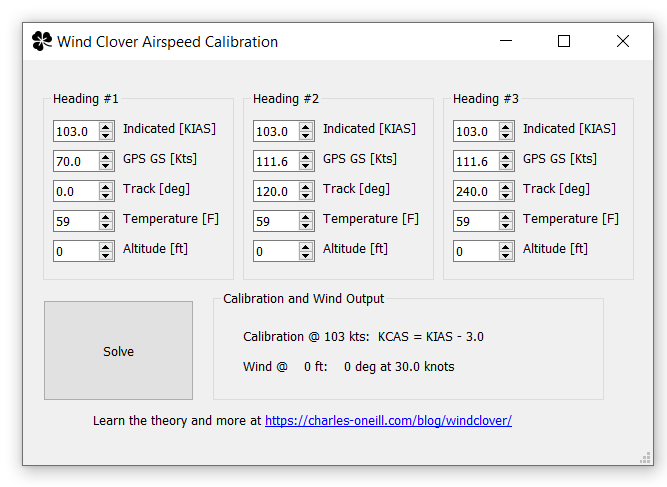
Requirements: You need an indicated airspeed, a GPS with track and groundspeed readouts, a thermometer, and your altitude. You will need to fly three independent headings (approximately 120 degrees apart) for each data point. You will need to download and enter your data into the windclover program.
Non-requirements: You do NOT need any ground references. You do NOT need to know your precise heading or magnetic variation. You do NOT need accurate timing or any clock. You do NOT need to calculate your true airspeed. You do NOT need an aerospace engineering background or on-board flight test engineers or hardware.
Cloverleaf Flight Profile: You will need to fly three lines that are approximately 120 degrees apart (e.g. 100, 220, 320). Maintain a constant heading, altitude, and indicated airspeed. Using your GPS, record your ground speed and track. Enter these data values into heading columns #1, #2, and #3. The program determines the wind direction/speed and the calibration from KIAS to KCAS.
Singularity Films Presents…

This is an engineering structures parody of the X Files from 1999 found in my class notes. April Fools… once every 20 years is about right for this engineering joke.
So why is this related to structural engineering? Well, there is a shortcut method using so-called singularity functions to calculate the moment and shear in beams. Refer to any classical engineering textbook. As my initial undergraduate instructor in a structural analysis course, Dr. Wolf Yeigh, would say, it’s a good tool to have in your pocket. FYI, that was an intense course and professor, but one that I’m really lucky and glad to have taken. And yes, I made an A.
DME Arc Geometry
In this note, you will discover a trigonometric identity to assist maintaining a DME arc. The DME arc is a common maneuver for instrument approach procedures consisting of flying a specified distance from a DME site. The VOR/DME-A approach (Figure 1) uses an 18 nm arc from the CLL Vortac at (1) to provide two arcs (highlighted in yellow) from IAFs at OWANY at (2) and OWDIM at (4) towards JISPU at (3).
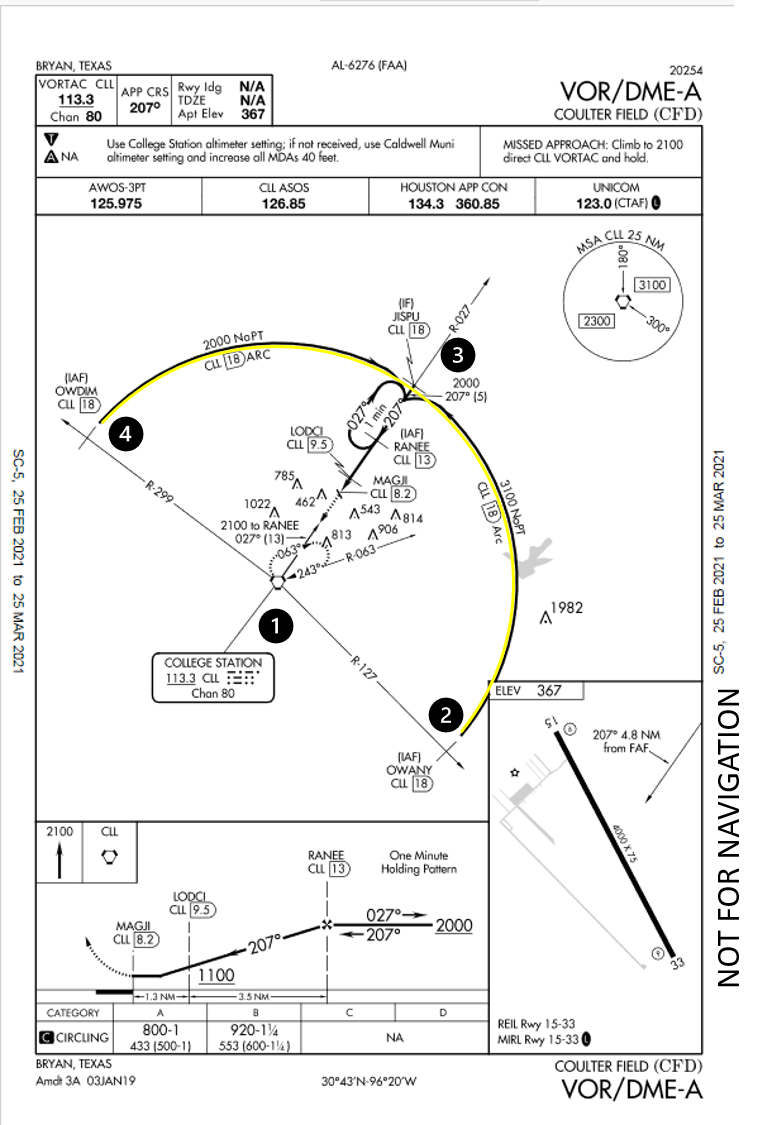
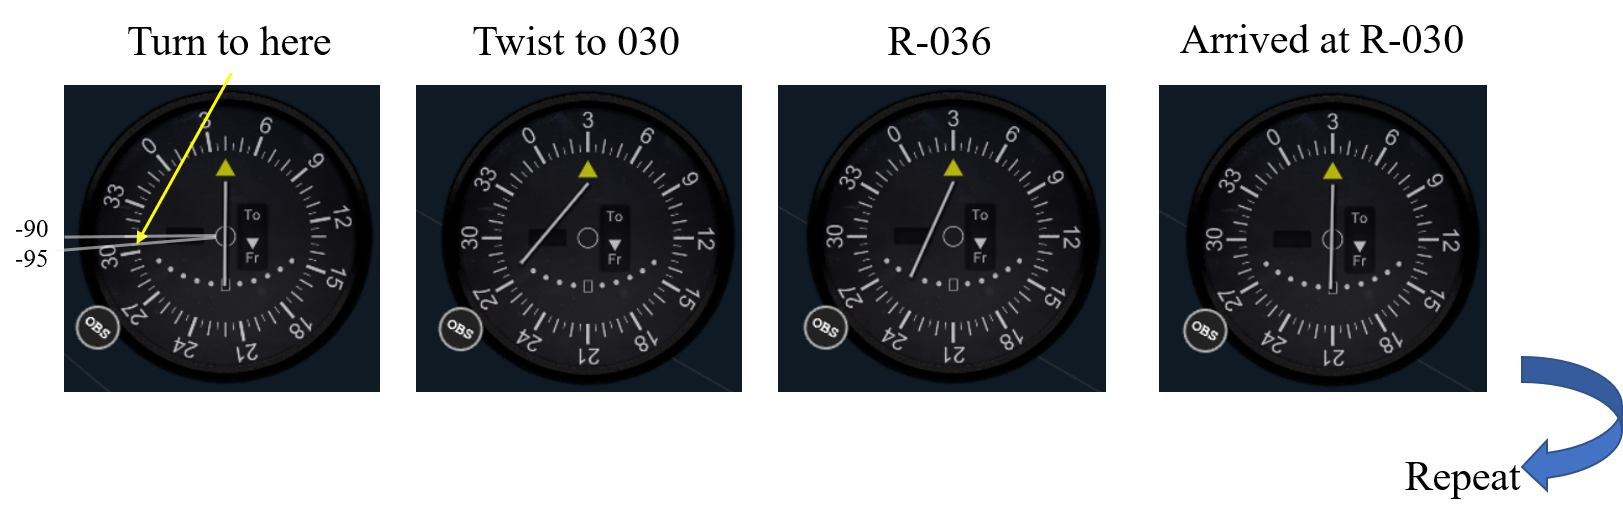
Using a Turn-Twist strategy, once on the arc, the heading to fly is tangent to the arc. This makes the no-wind control law: Turn to heading = Radial plus 90 deg when CW or Radial minus 90 deg when CCW. Unfortunately, this control strategy contains inherent divergence; in other words, the aircraft always tracks outside the desired arc (Figure 2, left). With a Turn 10/Twist 10 step, the cross track error is 1.5%. For example, a 20 nm arc with 10 degree radial steps, would give 0.3 nm error every step.
Is there a correction to exactly remain on the arc given a Turn-Twist step? Yes, and amazingly enough, the result is exact and a trigonometric identity. The right portion of Figure 2 derives a correction angle (gamma) such that the exact track is from point A to point B, both on the same arc. The result is that exactly half the Turn/Twist angle is applied inside the normal +-90 heading.

For example, using a Turn 10/Twist 10 in a counter clockwise direction at the R-040 would require the heading be 305 degrees; this heading will precisely keep you on the exact DME arc at the R-030 radial.
Warning: The normal flying caveats apply: 1) This is only meant for insight and is not meant as instruction or as a change to your specific flight operations manual, 2) wind will require varying correction angles, and 3) aviate, navigate, communicate.
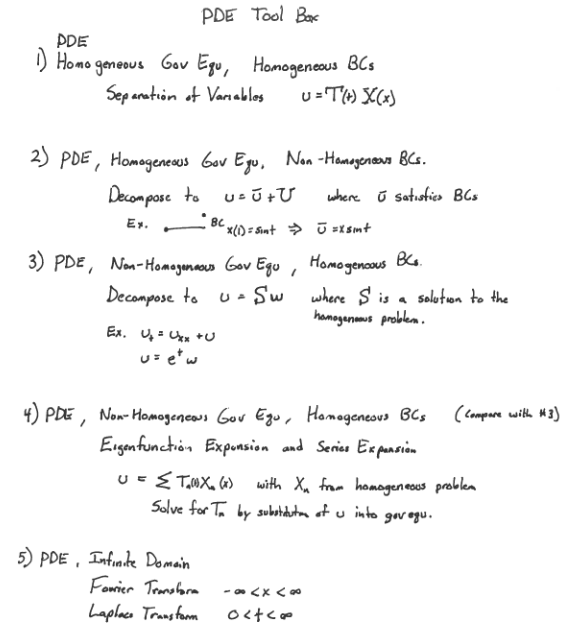
Classical Partial Differential Equations (PDE) Cheatsheet
The study of classical PDEs is a useful and typical course for engineers and scientists to both appreciate and understand the behavior of physical systems.
As the (former) instructor of a course in PDEs, I reviewed classical solution techniques in a lecture titled A brief history of GES 554 PDE to prepare students for their final exam. This lecture makes an excellent refresher or rapid introduction.
If you want to review the entire 50 lecture course, visit here. Feel free to call it The Brief History of the World of PDEs in 50 Parts.
Topics covered are:
- Motivation, classification & canonical forms
- Diffusion, Elliptic, Hyperbolic, and Transport PDEs
- Solution methods: Series, Separation of variables, Monte Carlo, finite difference, Ritz / Galerkin and Transforms
- 1 page PDE toolbox
- Laplace vs Fourier transforms for PDEs
- Sturm Liouville Theory
- Wave Equations
- Strings, Beams, and Drums
- Characteristics in transport equations
- Systems of PDEs: eigenvalues & eigenvectors
- Green’s Functions
- Calculus of Variations for PDEs